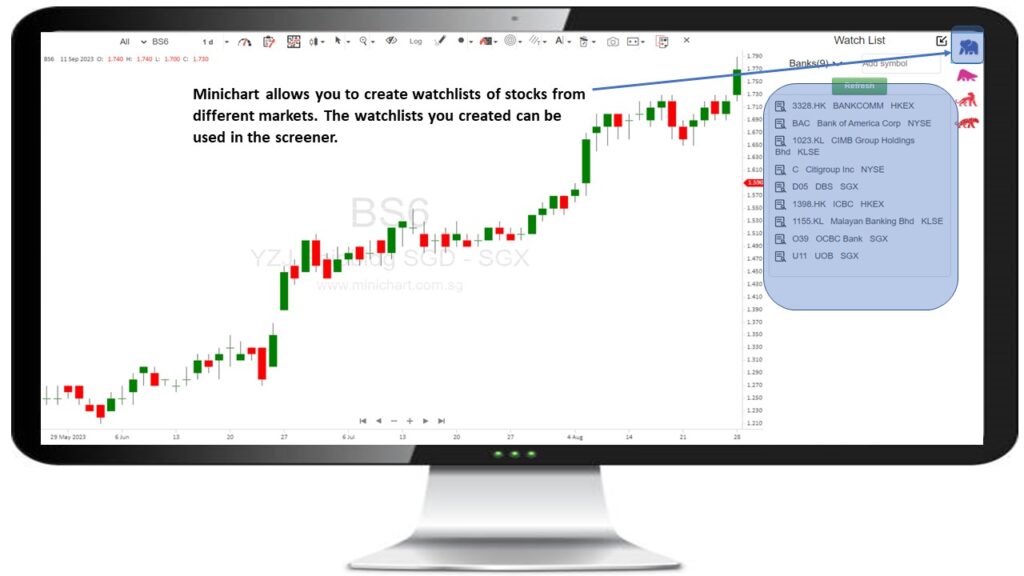
An essential tool for traders is a watchlist, which simplifies trading by allowing you to gather your preferred markets in one convenient location. Thus, when time is not on your side, you don’t need to manually search for markets when trading from your desk or while on the go.
To help them make better investing selections, a trader or investor may compile a watchlist containing a few, dozens, or even hundreds of trading instruments. An investor can monitor companies and remain up to date on financial or other developments that may affect these products by using a watchlist.
Usually, the investor keeps an eye on the list and holds off on putting trade orders until a certain conditions are satisfied, such trading above a specific volume, breaking out of a 52-week range, or rising above its 200-day moving average. Here’s how you can create a watchlist in Minichart.

Minichart allows you to create watchlists of stocks from different markets. The watchlists you created can be used in the screener.