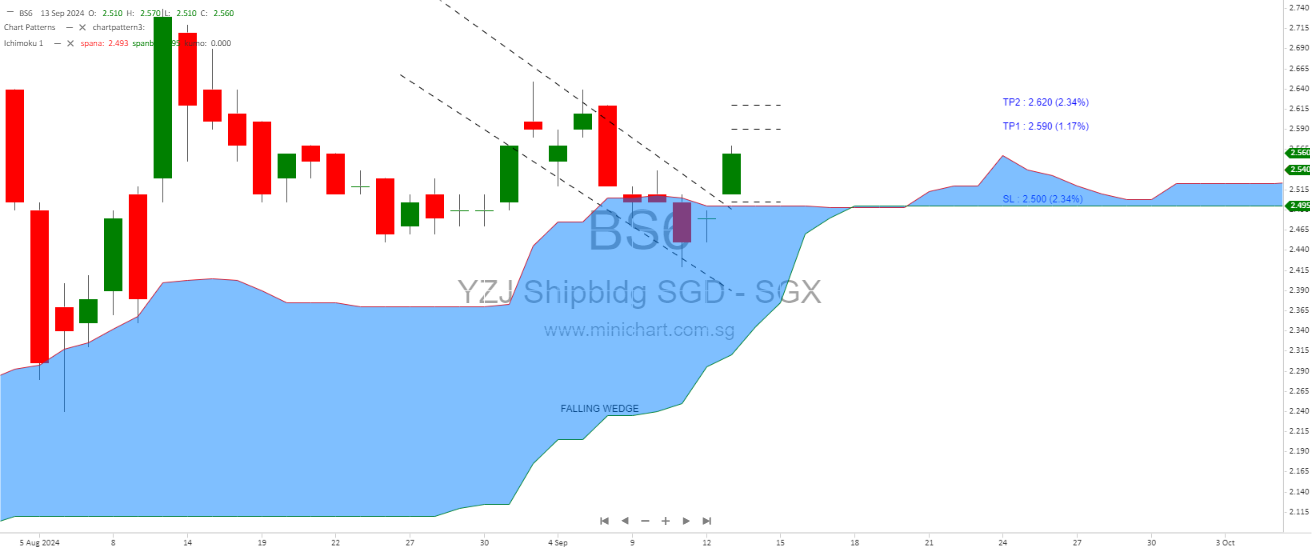
 YZJ:$2.56, above ichimoku cloud and a bullish falling wedge.
Above the Ichimoku Cloud:
The Ichimoku Cloud is a popular technical indicator used to gauge momentum, trend direction, and potential support or resistance levels. The cloud itself is formed by two lines:
- Senkou Span A (Leading Span A)
- Senkou Span B (Leading Span B)
If YZJ is trading above the cloud, this is generally interpreted as a bullish signal, suggesting the stock is in an uptrend. Traders often use this indicator to identify potential buying opportunities because it suggests that the price momentum is favoring the bulls.
3. Bullish Falling Wedge:
A falling wedge is a bullish reversal pattern that typically forms during a downtrend but signals a potential upward breakout. This pattern is characterized by:
- A narrowing range of prices with lower highs and lower lows.
- The volume often decreases as the wedge forms, with a potential breakout occurring on an increase in volume.
When the stock price breaks out of this wedge pattern to the upside, it typically signals a strong bullish move. In this case, the mention of a bullish falling wedge suggests that YZJ may have broken above this pattern, indicating a potential further increase in price from the current $2.56.
Summary:
- YZJ at $2.56: The price itself is showing that the stock is performing well.
- Above the Ichimoku Cloud: Indicates a bullish sentiment and that the stock is in an uptrend.
- Bullish Falling Wedge: A classic reversal pattern suggesting that after a period of consolidation or decline, the stock could see a breakout to higher levels.
Thank you
