The Double Top and Double Bottom chart patterns are powerful and reliable reversal patterns used in technical analysis. These patterns signal a potential shift in market direction and are widely used by traders to identify key turning points in price trends.
- Double Top: A bearish reversal pattern that signals the transition from an uptrend to a downtrend.
- Double Bottom: A bullish reversal pattern that signals the transition from a downtrend to an uptrend.
How Double Top and Double Bottom Patterns Work for Buying and Selling
Double Top:
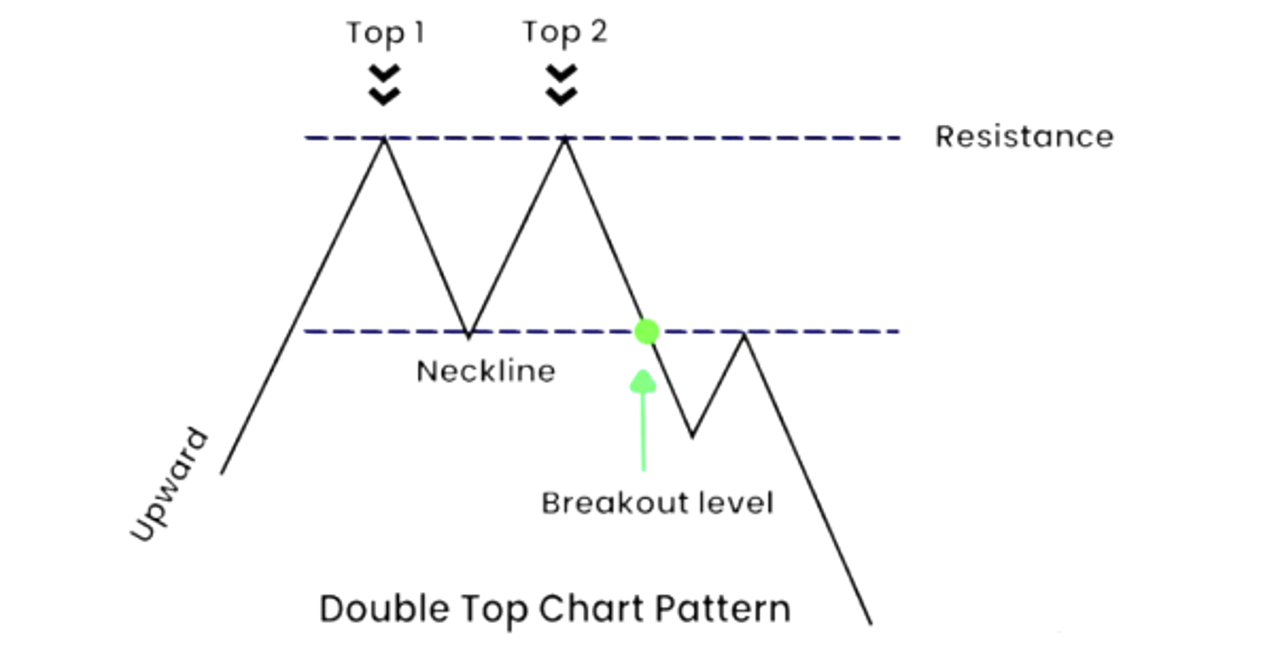
- Formation: The Double Top pattern forms after an uptrend and consists of two distinct peaks at roughly the same price level. The two peaks are separated by a trough. The pattern completes when the price breaks below the support level formed by the trough, indicating a reversal from bullish to bearish sentiment.
- First Top: The first peak forms as part of the uptrend, but after reaching a high, the price pulls back to form a trough.
- Second Top: The price rises again, forming a second peak at or near the level of the first peak, but fails to break higher. This failure indicates that buying pressure is weakening.
- Selling Signal: Traders typically sell when the price breaks below the support level (the low between the two peaks). This confirms that the bulls have lost control, and the bears are now taking over, signalling the start of a downtrend.
- Buying Signal: The Double Top is primarily a bearish pattern, so there isn’t a conventional buying signal. However, some traders may look for a countertrend rally after the price hits a major support level following the breakdown.
- Stop-Loss Consideration: A stop-loss order can be placed just above the second top to limit potential losses in case the breakout is false or the trend reverses unexpectedly.
Double Bottom:
- Formation: The Double Bottom pattern is the opposite of the Double Top and forms after a downtrend. It consists of two distinct troughs at roughly the same price level, separated by a peak. The pattern completes when the price breaks above the resistance level formed by the peak, indicating a reversal from bearish to bullish sentiment.
- First Bottom: The first trough forms as part of the downtrend, but after reaching a low, the price rallies to form a peak.
- Second Bottom: The price falls again, forming a second trough at or near the level of the first trough, but fails to break lower. This failure indicates that selling pressure is weakening.
- Buying Signal: Traders typically buy when the price breaks above the resistance level (the high between the two bottoms). This confirms that the bears have lost control, and the bulls are now in control, signaling the start of an uptrend.
- Selling Signal: The Double Bottom is primarily a bullish pattern, so there isn’t a conventional selling signal. However, if the price fails to break above resistance or falls back below support, it could be a signal to sell.
- Stop-Loss Consideration: A stop-loss order can be placed just below the second bottom to limit potential losses in case the breakout fails or the trend reverses back into a downtrend.
Measuring Price Targets:
- In both Double Top and Double Bottom patterns, the potential price target after a breakout can be estimated by measuring the height between the peaks or troughs and the support/resistance line, and projecting that distance from the breakout point. This provides traders with a rough target for where the price might move after the breakout.
The Psychology Behind Double Top and Double Bottom Patterns
The psychology behind the Double Top and Double Bottom patterns reflects the changing balance of power between buyers and sellers in the market. Understanding the psychology of these patterns can help traders better interpret price action.
Double Top Psychology:
- First Top: During the uptrend, buyers are in control and push the price to a new high. However, after this high, some traders start to take profits, causing a pullback. The pullback may be seen as a temporary correction by many traders.
- Second Top: Buyers attempt to regain control and push the price to the previous high. However, this time, the buying pressure is not as strong, and the price fails to break the first high. This failure signals that the uptrend is losing momentum, and more sellers start to enter the market.
- Breakout (Bearish): When the price breaks below the support level, it confirms that buyers have been exhausted and sellers have taken control. This breakout signals a shift in market sentiment from bullish to bearish, leading to a downtrend.
Double Bottom Psychology:
- First Bottom: During the downtrend, sellers are in control and push the price to a new low. However, after this low, some traders start to buy, believing the price is oversold, which leads to a rally.
- Second Bottom: Sellers attempt to regain control and push the price back to the previous low. However, the selling pressure is not as strong this time, and the price fails to break below the first low. This failure indicates that the downtrend is losing momentum, and more buyers start to enter the market.
- Breakout (Bullish): When the price breaks above the resistance level, it confirms that sellers have been exhausted and buyers have taken control. This breakout signals a shift in market sentiment from bearish to bullish, leading to an uptrend.
In both cases, the breakout confirms the change in market sentiment and signals the start of a new trend.
How to Use Double Top and Double Bottom Patterns to Invest in the Stock Market
Double Top and Double Bottom patterns provide traders with clear signals for entering or exiting positions at key turning points in the market. Here’s how readers can apply these patterns in their stock market trading:
- Identifying Trend Reversals:
- Both the Double Top and Double Bottom patterns are reversal patterns, so they are most effective when used to identify potential turning points in trends. In an uptrend, the Double Top signals that the trend may be reversing to the downside, while in a downtrend, the Double Bottom signals a reversal to the upside.
- Traders should always wait for a confirmed breakout (below support for Double Top, above resistance for Double Bottom) before entering a trade, as this confirms the reversal.
-
- Volume Confirmation:
- A reliable breakout from a Double Top or Double Bottom pattern is usually accompanied by an increase in trading volume. Volume confirmation is essential because it shows that the breakout is supported by strong market participation.
 Traders should look for a significant spike in volume when the price breaks below the support level (Double Top) or above the resistance level (Double Bottom). A breakout with low volume may result in a false signal.
-
- Stop-Loss Orders:
- Proper risk management is crucial when trading Double Top and Double Bottom patterns. Traders should always use stop-loss orders to limit potential losses. For a Double Top, the stop-loss can be placed just above the second top, while for a Double Bottom, the stop-loss can be placed just below the second bottom.
- This ensures that if the breakout fails or the trend reverses, losses are minimized.
- Target Projection:
