The Expanding Diamond pattern, also known as a Diamond Top or Diamond Bottom, is a rare but powerful chart pattern used in technical analysis. It is generally a reversal pattern that signals a potential change in the trend direction. The pattern gets its name from its distinctive diamond-like shape, which forms when the price action creates a combination of expanding and contracting trendlines. The Expanding Diamond pattern is considered a bearish reversal pattern when it forms at the top of an uptrend (Diamond Top) and a bullish reversal pattern when it forms at the bottom of a downtrend (Diamond Bottom).
How Expanding Diamond Patterns Work for Buying and Selling
Diamond Top:
- Formation: A Diamond Top forms at the end of an uptrend. It starts with an Expanding Triangle, where the price makes higher highs and lower lows, increasing the volatility. After reaching the widest point, the pattern begins to contract, forming lower highs and higher lows, which creates the diamond shape. The price consolidates toward the centre of the diamond, indicating that the market is indecisive.
- Selling Signal: The bearish breakout occurs when the price breaks below the lower trendline of the diamond. This breakout indicates that the uptrend is over, and sellers are now in control, signalling the start of a downtrend. Traders typically enter short positions when the price breaks below the lower trendline of the diamond with high volume.
- Buying Signal: Since the Diamond Top is a bearish reversal pattern, it does not typically offer a direct buying signal. However, if the price fails to break below the lower trendline and instead breaks above the upper trendline, traders might consider it a continuation of the uptrend. This is a risky countertrend move that should only be taken with caution and confirmation from other indicators.
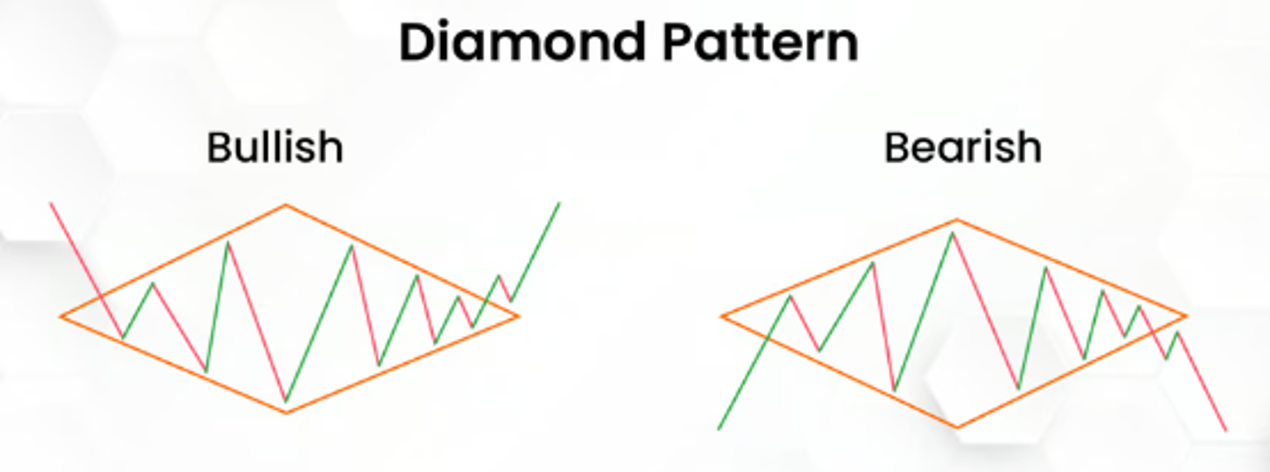
Diamond Bottom:
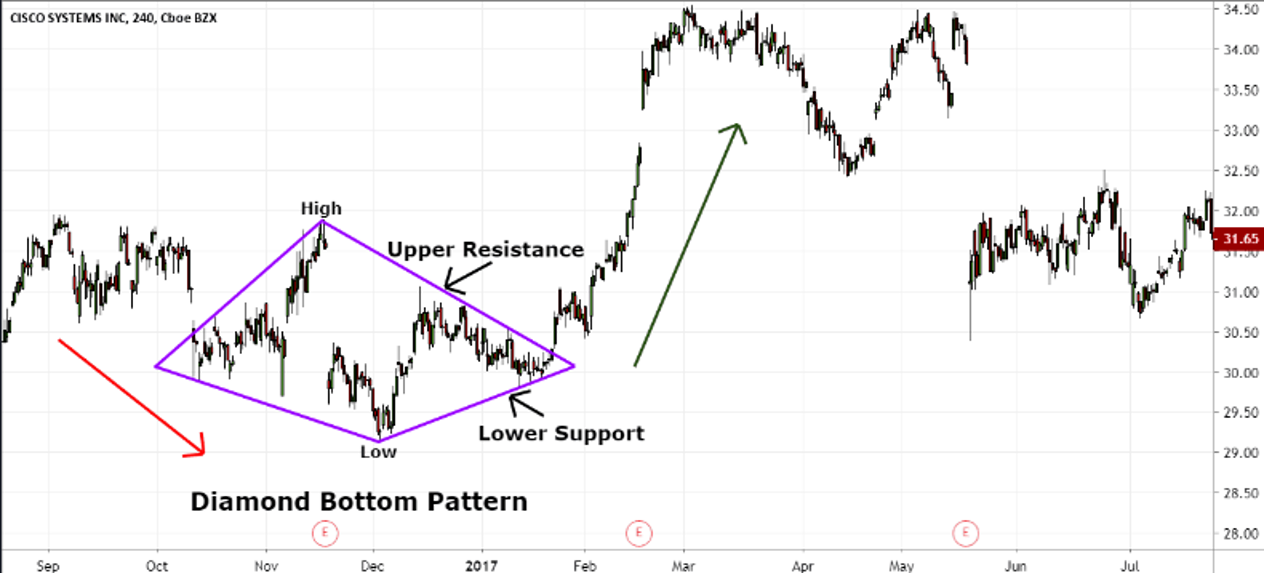
- Formation: A Diamond Bottom forms at the end of a downtrend. It starts with an Expanding Triangle, where the price makes lower lows and higher highs, widening the price range. After reaching the widest point, the pattern contracts, forming higher lows and lower highs, creating the diamond shape. This pattern signals that selling pressure is easing and buyers may be gaining control.
- Buying Signal: The bullish breakout occurs when the price breaks above the upper trendline of the diamond. This breakout indicates that the downtrend is over, and buyers are now in control, signalling the start of an uptrend. Traders typically enter long positions when the price breaks above the upper trendline of the diamond with high volume.
- Selling Signal: Since the Diamond Bottom is a bullish reversal pattern, it does not typically offer a direct selling signal. However, if the price fails to break above the upper trendline and instead breaks below the lower trendline, it may indicate that the downtrend will continue, and traders might consider selling or shorting the asset.
Measuring Price Targets:
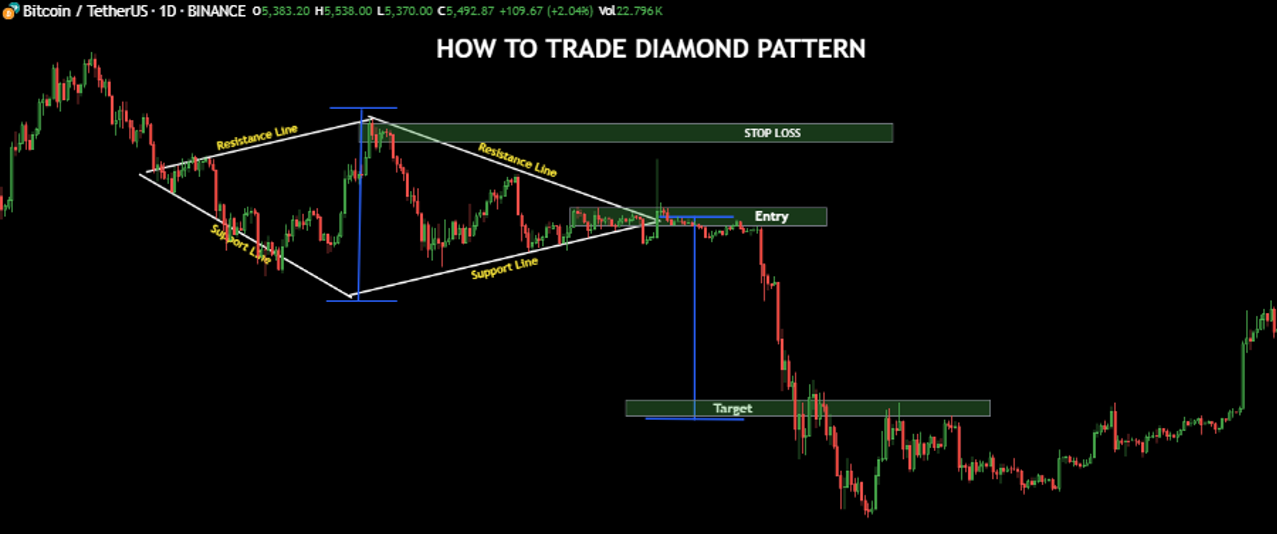
- For both the Diamond Top and Diamond Bottom, the potential price target after a breakout (or breakdown) can be estimated by measuring the height of the diamond (the distance between the highest and lowest points of the pattern) and projecting that distance from the breakout point. This provides traders with a rough idea of how far the price might move after the pattern completes.
The Psychology Behind Expanding Diamond Patterns
The psychology behind the Expanding Diamond pattern reflects growing indecision and volatility, followed by a clear resolution in the market’s direction. The pattern represents the tug of war between buyers and sellers before one side finally gains control.
Diamond Top Psychology:
- Expansion Phase (Buyer Exhaustion): In a Diamond Top, the price action begins with an expanding triangle where buyers push the price higher, but sellers start to push the price lower as well. This results in higher highs and lower lows, indicating increasing volatility. The pattern shows that buyers are still active, but the increasing price swings indicate that sellers are gaining momentum.
- Contraction Phase (Loss of Momentum): As the price approaches the centre of the diamond, the swings become smaller, with lower highs and higher lows, indicating a loss of momentum in the uptrend. Buyers are no longer able to push the price higher, and sellers start to take control. The market becomes increasingly indecisive.
- Breakout (Bearish Reversal): The breakout to the downside confirms that the buyers have lost control and that the sellers are dominating. The Diamond Top signals a trend reversal, and the price begins to move lower as the bears take over.
Diamond Bottom Psychology:
- Expansion Phase (Seller Exhaustion): In a Diamond Bottom, the price action begins with an expanding triangle where sellers push the price lower, but buyers start to push the price higher as well. This results in lower lows and higher highs, indicating increasing volatility. The pattern shows that sellers are still active, but the widening price swings indicate that buyers are gaining strength.
- Contraction Phase (Loss of Downward Momentum): As the price moves toward the centre of the diamond, the swings become smaller, with higher lows and lower highs, signalling that the downtrend is losing momentum. Sellers are no longer able to push the price lower, and buyers start to take control. The market becomes increasingly indecisive.
- Breakout (Bullish Reversal): The breakout to the upside confirms that sellers have lost control, and buyers are now in control. The Diamond Bottom signals a trend reversal, and the price begins to move higher as the bulls take over.
How to Use Expanding Diamond Patterns to Invest in the Stock Market
Expanding Diamond patterns provide traders with clear signals for entering or exiting positions at key turning points in the market. Here’s how traders can apply these patterns in stock market trading:
- Trend Reversal Trading:
- Diamond Top (Bearish Reversal): The Diamond Top is a bearish reversal pattern that signals the end of an uptrend. Traders can use this pattern to identify short-selling opportunities. After the price breaks below the lower trendline of the diamond, traders can enter short positions, expecting the price to move lower as the downtrend begins.
- Diamond Bottom (Bullish Reversal): The Diamond Bottom is a bullish reversal pattern that signals the end of a downtrend. Traders can use this pattern to identify buying opportunities. After the price breaks above the upper trendline of the diamond, traders can enter long positions, expecting the price to move higher as the uptrend begins.
- Volume Confirmation:
- Volume is a critical factor in confirming breakouts and breakdowns in Expanding Diamond patterns. Traders should look for a significant increase in volume when the price breaks out of the diamond. Rising volume indicates that the breakout is supported by strong market participation.
- For example, a breakdown from a Diamond Top accompanied by increasing volume is a strong signal that the price is likely to continue lower. Conversely, a breakout from a Diamond Bottom with rising volume is a strong signal that the price is likely to continue higher.
- Stop-Loss Orders:
- Proper risk management is essential when trading Expanding Diamond patterns. Traders should place stop-loss orders just outside the opposite trendline of the breakout or breakdown to protect against false signals.
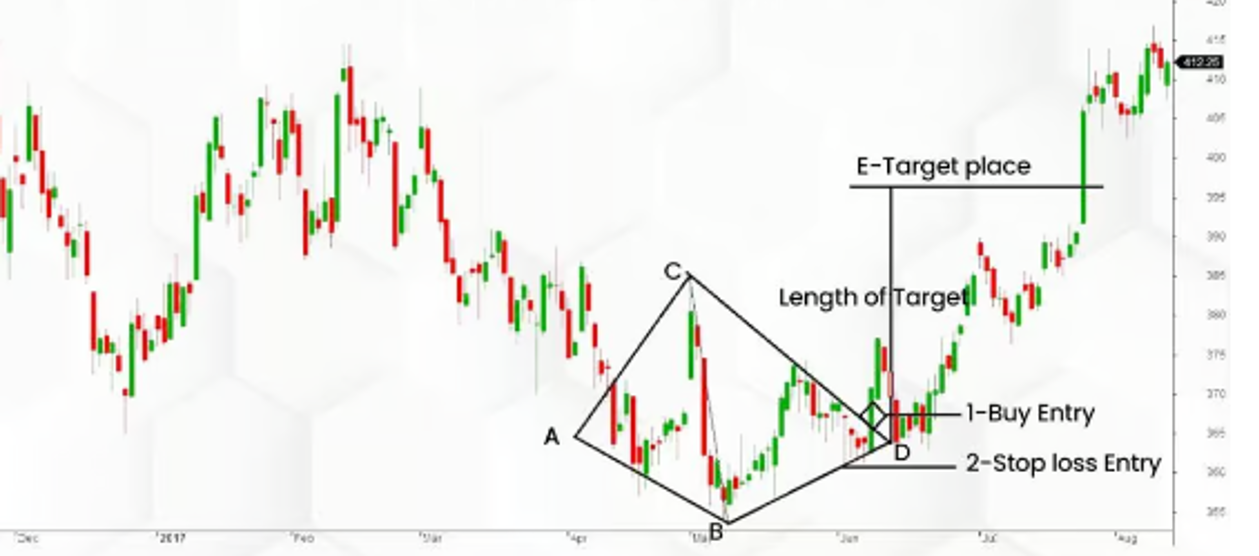
- For a short trade after a Diamond Top, the stop-loss should be placed just above the upper trendline of the diamond. For a long trade after a Diamond Bottom, the stop-loss should be placed just below the lower trendline of the diamond.
- Target Projection:
- Traders can estimate a price target for both the Diamond Top and Diamond Bottom patterns by measuring the height of the diamond and projecting that distance from the breakout or breakdown point. This gives traders a rough idea of how far the price might move after the breakout.
- Swing Trading:
- Expanding Diamond patterns are ideal for swing traders who look for major reversals in price trends. Swing traders can enter positions at the breakout or breakdown point and ride the new trend for a medium-term period before taking profits.
- Traders may also use trailing stop orders to lock in profits as the price moves in their favor.
- Combining with Other Indicators:
- Expanding Diamond patterns work best when used in conjunction with other technical indicators. For example, traders can use the RSI (Relative Strength Index) to determine whether the market is overbought (Diamond Top) or oversold (Diamond Bottom) before entering a trade.
- Moving averages can help confirm the strength of the trend reversal, and the MACD (Moving Average Convergence Divergence) can be used to assess the momentum behind the breakout.
Day Trading:
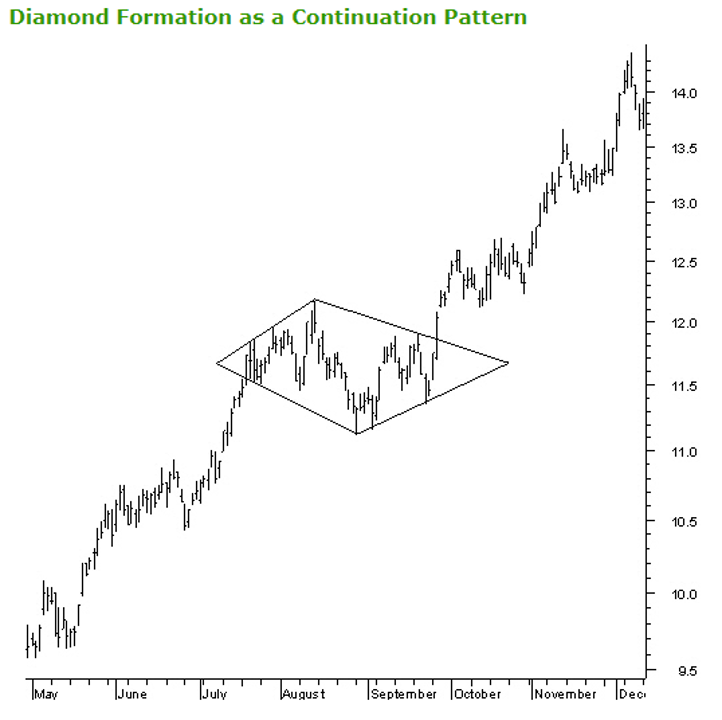
- Although Expanding Diamond patterns typically develop over longer periods, they can also be used for short term trading. In some rare cases, Diamond patterns can also turn out to be Continuation pattern.
- conclusion
The Expanding Diamond pattern is a rare but highly effective chart pattern that signals major trend reversals. It is characterized by an initial phase of high volatility and indecision, followed by a contraction in price movements, leading to a decisive breakout or breakdown. This pattern is useful for both bullish and bearish reversals, making it a versatile tool for traders and investors.
While the pattern provides clear entry and exit signals, it is crucial to confirm the breakout direction with increased volume and other technical indicators. By using the Expanding Diamond pattern in conjunction with proper risk management techniques, such as stop-loss orders and target projections, traders can capitalize on significant trend reversals in the stock market.
Thank you