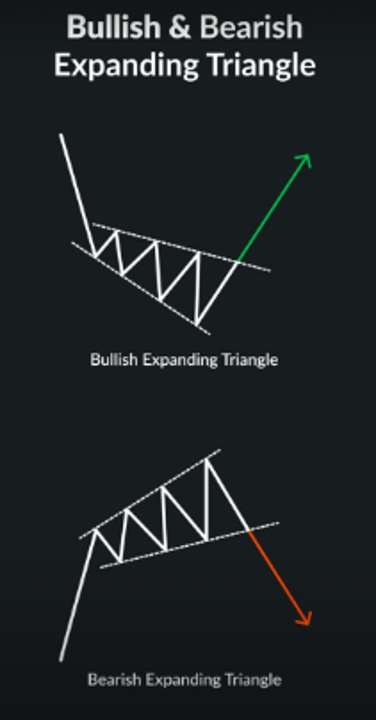
The Expanding Triangle pattern, also known as the Broadening Formation, is a chart pattern seen in technical analysis that represents increasing volatility and indecision in the market. It is characterized by a series of higher highs and lower lows, forming a widening triangle shape as the price swings become broader over time. This pattern signals uncertainty, where both buyers and sellers aggressively push the price in different directions. Expanding Triangles can indicate both trend reversals and continuations.
Although the Handle pattern typically refers to the Cup and Handle or Inverted Cup and Handle formation, in this context, the Handle can be seen as a smaller consolidation phase following an expansive price movement.
- How the Expanding Triangle Pattern Works for Buying and Selling
Expanding Triangle (Broadening Formation):
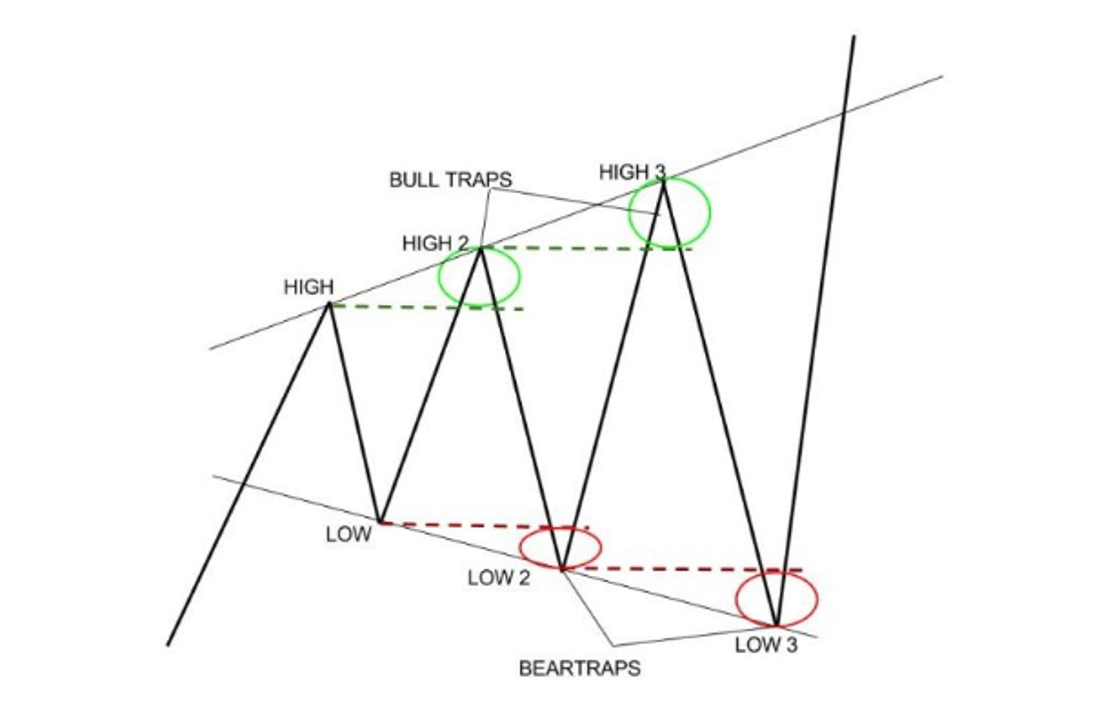
- Formation: The Expanding Triangle forms when the price makes a series of higher highs and lower lows. The price moves within two diverging trendlines—an upward-sloping resistance line and a downward-sloping support line. The expanding range reflects heightened market volatility and indecision, as both bulls and bears try to take control.
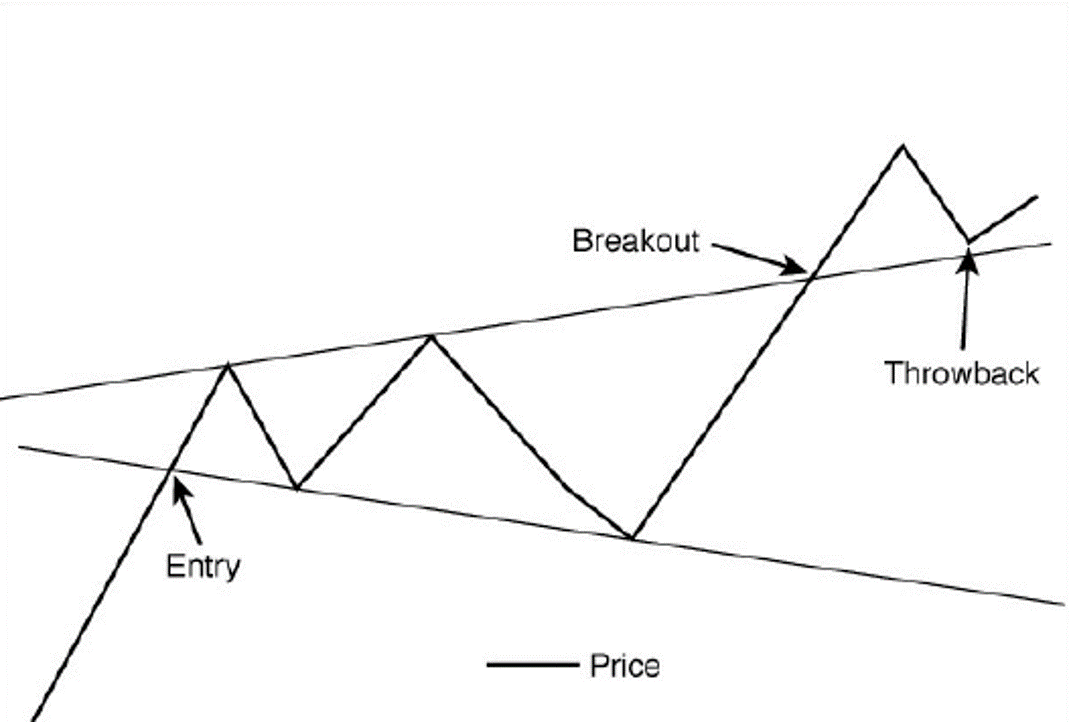
- Buying and Selling Dynamics: The price swings become broader with each successive move. Traders often wait for the price to break either the upper resistance or the lower support trendline before making their move.
- Buying Signal: A buy signal is triggered when the price breaks above the upper resistance trendline of the Expanding Triangle. This breakout suggests that the buyers have overpowered the sellers, and a continuation of the uptrend is likely. Traders typically enter a long position after a confirmed breakout to the upside.
- Selling Signal: A sell signal is triggered when the price breaks below the lower support trendline. This breakdown indicates that the sellers have taken control, and the price is likely to move lower, signalling a potential reversal or continuation of a downtrend. Traders often enter a short position after a confirmed breakdown to the downside.
- Stop-Loss Consideration: In a long trade, traders can place a stop-loss order below the most recent swing low within the Expanding Triangle. In a short trade, traders can place a stop-loss order above the most recent swing high within the pattern. This helps protect against false breakouts or breakdowns.
Handle Pattern (Consolidation Phase):
- Formation: The Handle pattern, typically found after an extensive price movement (like in the Cup and Handle or Inverted Cup and Handle), is a smaller consolidation phase where the price moves sideways or slightly downward before resuming its previous trend.
- Buying Signal: In a bullish Handle pattern (as seen in the Cup and Handle), a buy signal is triggered when the price breaks above the upper trendline of the handle, indicating that the consolidation phase is over, and the uptrend is resuming.
- Selling Signal: In a bearish Handle pattern (as seen in the Inverted Cup and Handle), a sell signal is triggered when the price breaks below the lower trendline of the handle, indicating that the consolidation phase is over, and the downtrend is resuming.
- Stop-Loss Consideration: Traders can place a stop-loss order just below the lower trendline of the handle (for a bullish handle) or just above the upper trendline (for a bearish handle) to protect against false breakouts.
Measuring Price Targets:
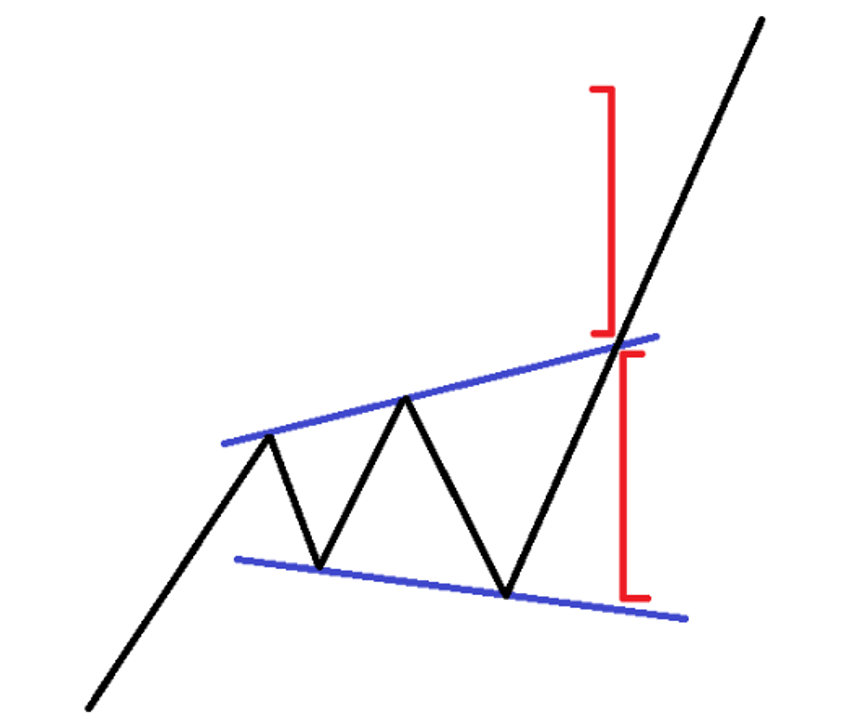
- For the Expanding Triangle, the potential price target after a breakout or breakdown can be estimated by measuring the distance between the highest high and the lowest low within the triangle and projecting that distance from the breakout point.
- For the Handle pattern, the price target can be measured by calculating the height of the prior pattern (such as the cup in a Cup and Handle) and projecting that distance from the breakout point of the handle.
The Psychology Behind Expanding Triangle and Handle Patterns
Expanding Triangle Psychology:
- Increasing Market Volatility and Indecision: The Expanding Triangle pattern reflects increasing market volatility and indecision among traders. Each swing within the triangle becomes more exaggerated, as both buyers and sellers struggle to take control. The pattern represents a period of heightened emotional trading, where uncertainty dominates the market.
- Breakout (Bullish or Bearish): A breakout to either side signals that the market has finally decided. A breakout to the upside indicates that buyers have regained control, while a breakdown to the downside indicates that sellers have won the battle. The direction of the breakout resolves the prior indecision and volatility, and the price typically makes a strong move in that direction.
Handle Psychology:
- Consolidation After an Impulse Move: The Handle pattern represents a period of consolidation after a significant price movement. This consolidation phase allows the market to “catch its breath” before continuing in the direction of the previous trend. Traders and investors use this period to evaluate the market, and once the price breaks out of the handle, it signifies that the prevailing trend is ready to resume.
- Breakout (Continuation): The breakout from the handle confirms that the brief consolidation is over, and the market is ready to continue its previous trend. In the case of a Cup and Handle, this breakout signals the continuation of the uptrend, while in the Inverted Cup and Handle, it signals the continuation of the downtrend.
- How to Use Expanding Triangle and Handle Patterns to Invest in the Stock Market
- Breakout and Breakdown Trading:
- Expanding Triangle: Traders can use the Expanding Triangle pattern to trade breakouts or breakdowns. When the price breaks above the upper trendline, it signals a buy opportunity, while a breakdown below the lower trendline signals a sell or short-selling opportunity.
- Handle Pattern: Traders can use the Handle pattern (often seen in the Cup and Handle or Inverted Cup and Handle) to trade the continuation of a trend. After the price completes the handle and breaks out, traders can enter a long or short position, depending on the direction of the breakout.
- Volume Confirmation:
- Expanding Triangle: Volume is critical in confirming breakouts and breakdowns in Expanding Triangle patterns. Traders should look for a significant increase in volume when the price breaks out of the expanding range. This confirms that the breakout or breakdown is supported by strong market participation.
- Handle Pattern: Similarly, in the Handle pattern, a strong breakout or breakdown is often accompanied by rising volume. This volume confirmation helps validate the move and reduces the risk of false breakouts.
- Stop-Loss Orders:
- Expanding Triangle: Traders should use stop-loss orders to manage risk when trading Expanding Triangles. For long trades, the stop-loss can be placed below the most recent swing low within the pattern. For short trades, the stop-loss can be placed above the most recent swing high.
- Handle Pattern: In the Handle pattern, stop-loss orders can be placed just below the lower trendline of the handle (for bullish trades) or just above the upper trendline of the handle (for bearish trades).
- Target Projection:
- Expanding Triangle: Traders can estimate a price target for the Expanding Triangle by measuring the widest point of the triangle and projecting that distance from the breakout or breakdown point. This gives traders a rough idea of how far the price might move after the breakout.
- Handle Pattern: For the Handle pattern, traders can measure the height of the prior pattern (such as the cup in a Cup and Handle) and project that distance from the breakout point of the handle.
- Swing Trading:
- Expanding Triangle: The Expanding Triangle pattern can be useful for swing traders who are looking to trade larger price movements. Traders can enter positions at the breakout or breakdown point and ride the trend for a medium-term period.
- Handle Pattern: The Handle pattern is also ideal for swing traders, as it signals the continuation of a prior trend. Swing traders can enter trades at the breakout point and hold positions until the trend starts to lose momentum.
- Combining with Other Indicators:
- Expanding Triangle: Traders can combine the Expanding Triangle pattern with other technical indicators like moving averages, RSI, or MACD to confirm the strength of the breakout or breakdown.
- Handle Pattern: For the Handle pattern, using indicators like the RSI can help confirm whether the market is overbought (for bearish setups) or oversold (for bullish setups). Moving averages can also be used to confirm the trend direction and the strength of the breakout.
- Day Trading:
- Expanding Triangle: Although the Expanding Triangle pattern typically develops over longer periods, it can also be used for day trading on shorter timeframes. Day traders can capitalize on the quick price movements that often follow a breakout or breakdown, but they must manage risk tightly using stop-loss orders and realistic price targets.
- Handle Pattern: Similarly, the Handle pattern can also be used for day trading. Traders can enter trades after a breakout and take advantage of short-term price movements.
Conclusion:
The Expanding Triangle and Handle patterns are valuable tools in technical analysis that can help traders identify key entry and exit points in the market. While the Expanding Triangle signals increasing volatility and indecision, the Handle pattern provides a clear continuation signal after a consolidation phase. Whether you’re a day trader, swing trader, or long-term investor, understanding how to identify and trade these patterns can enhance your success in the stock market. By using volume confirmation, setting appropriate stop-loss orders, and combining these patterns with other technical indicators, traders can capitalize on breakouts, breakdowns, and trend continuations with confidence.
