Head and Shoulders Chart Pattern in Technical Analysis
The Head and Shoulders chart pattern is one of the most reliable and well-known reversal patterns in technical analysis. It indicates a potential change in trend direction, from bullish to bearish or vice versa, and is often seen as a signal that the current trend is coming to an end.
There are two types of Head and Shoulders patterns:
- Head and Shoulders (Standard): A bearish reversal pattern that signals the transition from an uptrend to a downtrend.
- Inverse Head and Shoulders: A bullish reversal pattern that signals the transition from a downtrend to an uptrend.
How the Head and Shoulders Chart Pattern Works for Buying and Selling
Standard Head and Shoulders:
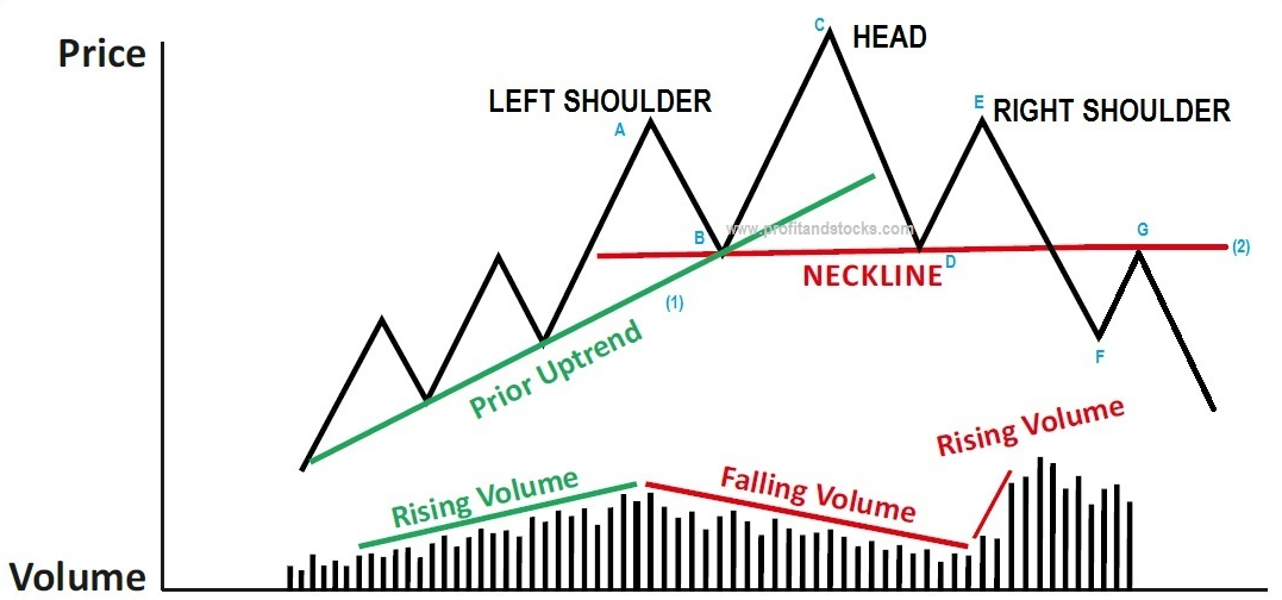
Formation: The standard Head and Shoulders pattern forms at the end of an uptrend and consists of three peaks:
- Left Shoulder: The first peak forms during the uptrend and is followed by a small pullback.
- Head: The second peak is higher than the left shoulder and represents the highest point in the pattern.
- Right Shoulder: The third peak is lower than the head and approximately equal in height to the left shoulder.
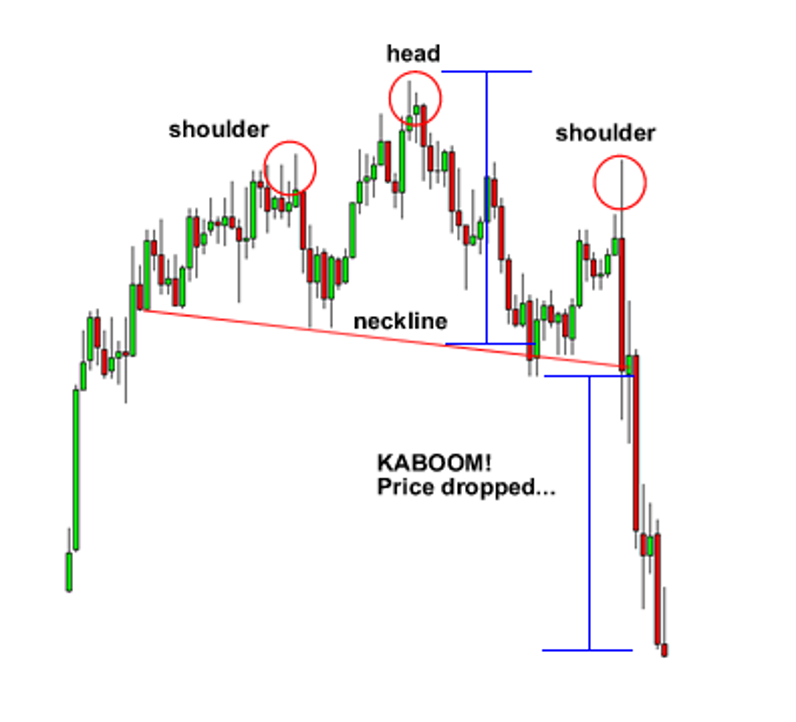
Below these three peaks, a support level (called the neckline) connects the lows formed after each peak. The pattern is complete when the price breaks below the neckline.
Selling Signal: Traders typically enter a sell position when the price breaks below the neckline, as this confirms the end of the uptrend and the start of a downtrend. A successful breakout signals that the bears have taken control of the market.
Buying Signal: While the Head and Shoulders pattern is primarily bearish, some traders may look to buy if the price finds support at the neckline after the breakout and begins to reverse upward. However, this is considered a risky countertrend trade.
Stop-Loss Consideration: A stop-loss order can be placed just above the right shoulder to limit potential losses if the breakout fails or the trend unexpectedly reverses.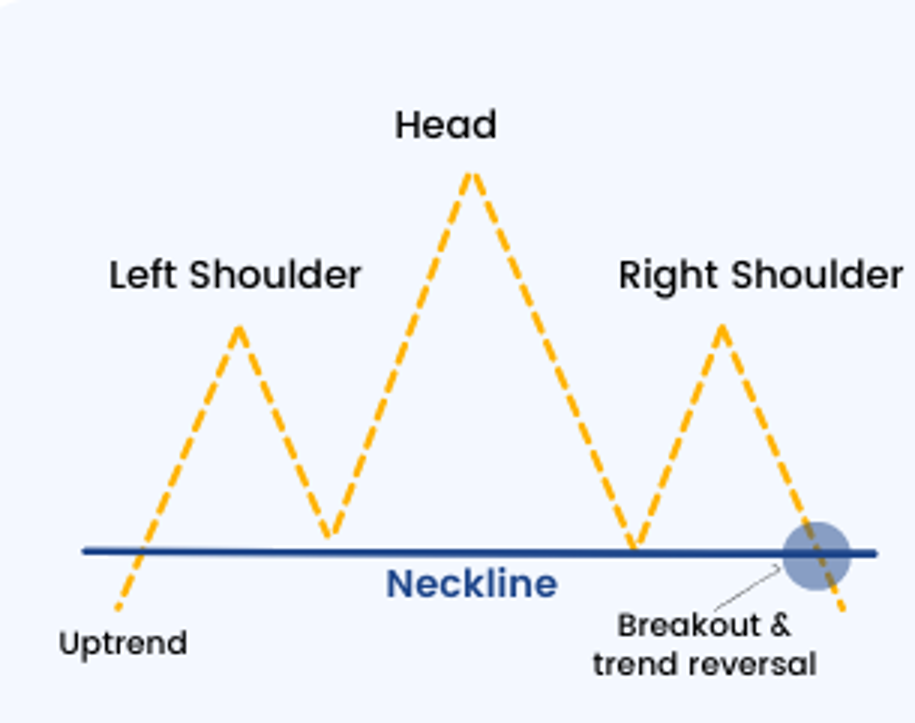
Inverse Head and Shoulders:
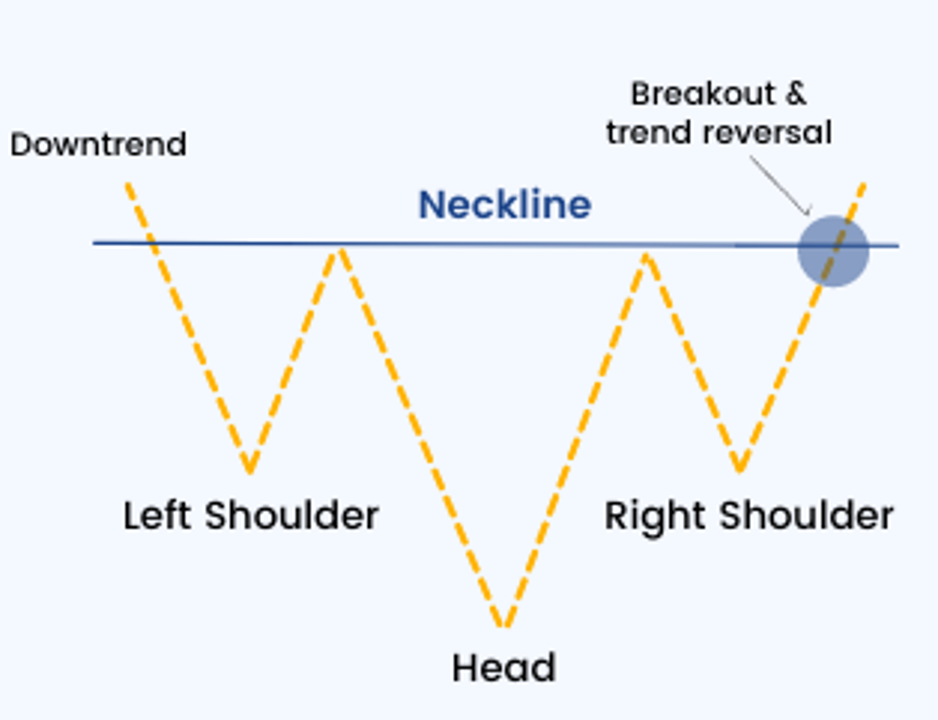
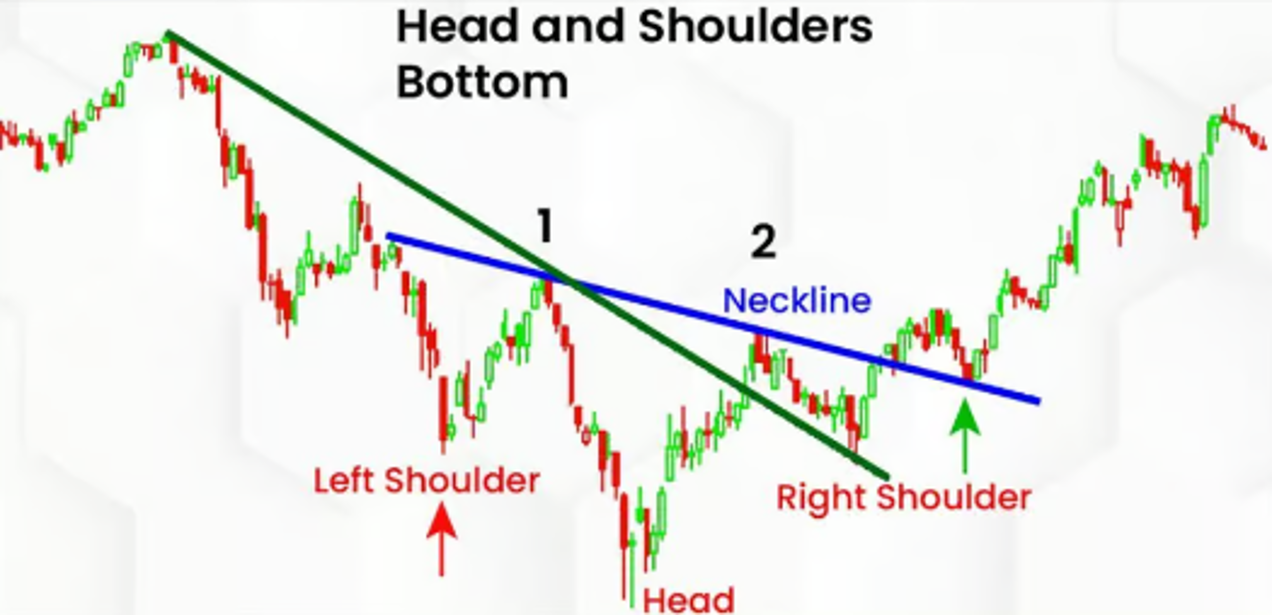
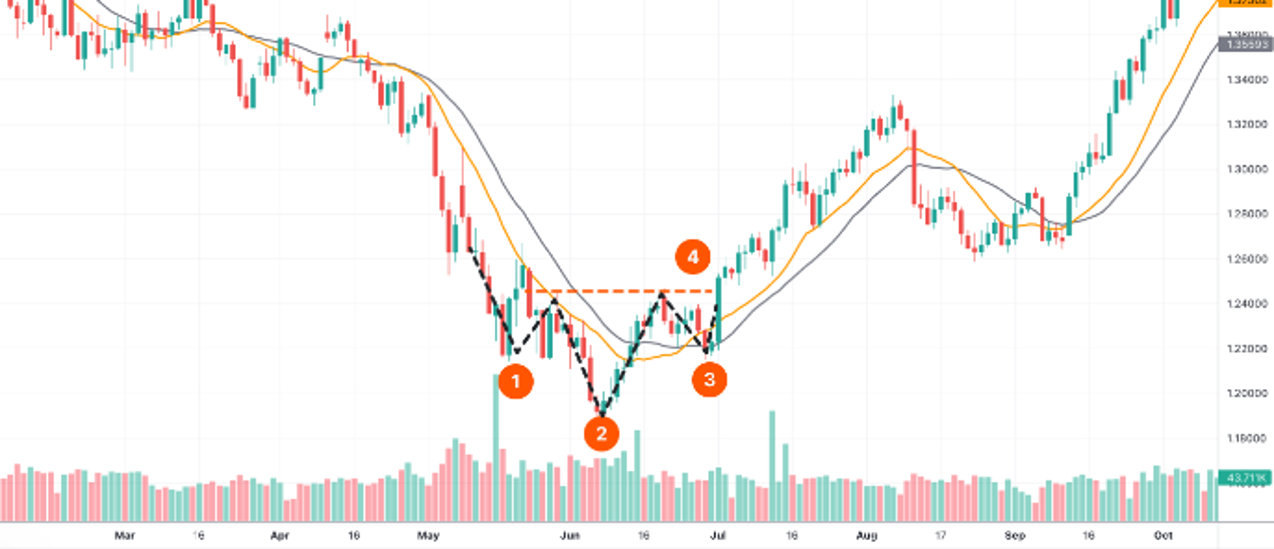
- Formation: The Inverse Head and Shoulders pattern is the opposite of the standard Head and Shoulders and forms at the end of a downtrend. It consists of:
- Left Shoulder: The first trough forms during the downtrend, followed by a small upward correction.
- Head: The second trough is lower than the left shoulder and represents the lowest point in the pattern.
- Right Shoulder: The third trough is higher than the head and approximately equal in height to the left shoulder.
A resistance level (also called the neckline) connects the highs formed after each trough. The pattern is complete when the price breaks above the neckline.
- Buying Signal: A buy signal occurs when the price breaks above the neckline, confirming that the downtrend has ended and the bulls are taking control. Traders often enter a long position after the breakout to capitalize on the new uptrend.
- Selling Signal: In rare cases, the price may fail to break above the neckline and instead resume the downtrend. In this scenario, traders could sell if the price breaks below the right shoulder.
- Stop-Loss Consideration: A stop-loss order can be placed just below the right shoulder to limit potential losses if the breakout fails and the trend reverses back into a downtrend.
Measuring Price Targets:
- A price target after a breakout from a Head and Shoulders pattern can be estimated by measuring the distance from the head to the neckline and projecting that distance from the breakout point. This gives traders a rough idea of the potential price movement after the breakout.
The Psychology Behind Head and Shoulders Chart Patterns
The psychology behind the Head and Shoulders pattern reflects a shift in market sentiment from bullish to bearish (or vice versa in the case of the Inverse Head and Shoulders). Understanding the psychological dynamics of this pattern can help traders better anticipate price movements.
Standard Head and Shoulders Psychology:
- Left Shoulder: During the uptrend, buyers are in control, pushing the price higher to form the left shoulder. However, after this peak, some traders start to take profits, causing a small pullback.
- Head: Buyers attempt to regain control and push the price to a new high, forming the head of the pattern. However, after this new high, more traders start to take profits, and selling pressure increases.
- Right Shoulder: The right shoulder forms as buyers make a final attempt to push the price higher, but they are unable to reach the same height as the head. This failure to make a new high signals that the uptrend is weakening and that sellers are gaining control.
- Breakout (Bearish): When the price breaks below the neckline, it confirms that the bulls have lost control and the bears have taken over. This signals the start of a new downtrend, as more traders rush to sell.
Inverse Head and Shoulders Psychology:
- Left Shoulder: During the downtrend, sellers are in control, pushing the price lower to form the left shoulder. However, after this low, some buyers step in, causing a small upward correction.
- Head: Sellers attempt to regain control and push the price to a new low, forming the head of the pattern. However, after this new low, more buyers start to step in, and buying pressure increases.
- Right Shoulder: The right shoulder forms as sellers make a final attempt to push the price lower, but they are unable to reach the same low as the head. This failure to make a new low signals that the downtrend is weakening and that buyers are gaining control.
- Breakout (Bullish): When the price breaks above the neckline, it confirms that the sellers have lost control and the bulls have taken over. This signals the start of a new uptrend, as more traders rush to buy.
In both cases, the breakout confirms the change in market sentiment and signals a new trend direction.
How to Use the Head and Shoulders Pattern to Invest in the Stock Market
The Head and Shoulders pattern provides traders with clear signals to enter or exit the market at key reversal points. Here’s how readers can apply this pattern in their stock market trading:
- Identifying Trend Reversals:
- The Head and Shoulders pattern is a reversal pattern, so it’s best used to identify when a trend is likely to change direction. In an uptrend, the standard Head and Shoulders pattern can signal the start of a new downtrend, while in a downtrend, the Inverse Head and Shoulders pattern can signal the start of a new uptrend.
- Traders should always wait for the price to break the neckline before entering a trade, as this confirms the reversal. Entering a trade before the breakout can be risky, as the price may continue in the original trend.
- Volume Confirmation:
- A reliable breakout from a Head and Shoulders pattern is usually accompanied by an increase in trading volume. Volume confirmation is essential because it shows that the breakout is supported by strong market participation.
- Traders should look for a significant increase in volume when the price breaks below (or above, in the case of the Inverse Head and Shoulders) the neckline. A breakout with low volume may result in a false signal.
- Stop-Loss Orders:
- Proper risk management is crucial when trading the Head and Shoulders pattern. Traders should always use stop-loss orders to limit potential losses. For a standard Head and Shoulders, the stop-loss can be placed just above the right shoulder, while for an Inverse Head and Shoulders, the stop-loss can be placed just below the right shoulder.
- This ensures that if the breakout fails or the trend reverses, losses are minimized.
- Measuring Price Targets:
- A price target can be calculated by measuring the distance from the head to the neckline and projecting that distance from the breakout point. This gives traders a rough idea of how far the price is likely to move after the breakout and helps them set realistic profit-taking targets.
- Swing Trading:
- The Head and Shoulders pattern is ideal for swing traders, as it signals major reversals in price trends. Swing traders can enter positions at the breakout point and ride the new trend for a short period before taking profits.
- Swing traders can also use trailing stop orders to lock in profits as the price moves in their favor.
- Combining with Other Indicators:
- The Head and Shoulders pattern is most effective when used in conjunction with other technical indicators. For example, traders can combine the pattern with momentum indicators like the RSI or Moving Average Convergence Divergence (MACD) to confirm the reversal’s strength and reduce the likelihood of false signals.
- Moving averages can also help traders identify the broader trend direction and determine whether the reversal is likely to be sustained.
Conclusion:
The Head and Shoulders chart pattern is one of the most reliable reversal patterns in technical analysis, providing traders with clear entry and exit signals when a trend is about to reverse. Whether you’re trading stocks, forex, or other assets, understanding how to recognize the Head and Shoulders pattern and trade breakouts can significantly enhance your success in the market. By using volume confirmation, setting appropriate stop-loss orders, and combining this pattern with other technical indicators, traders can capitalize on trend reversals with confidence. Thank you
