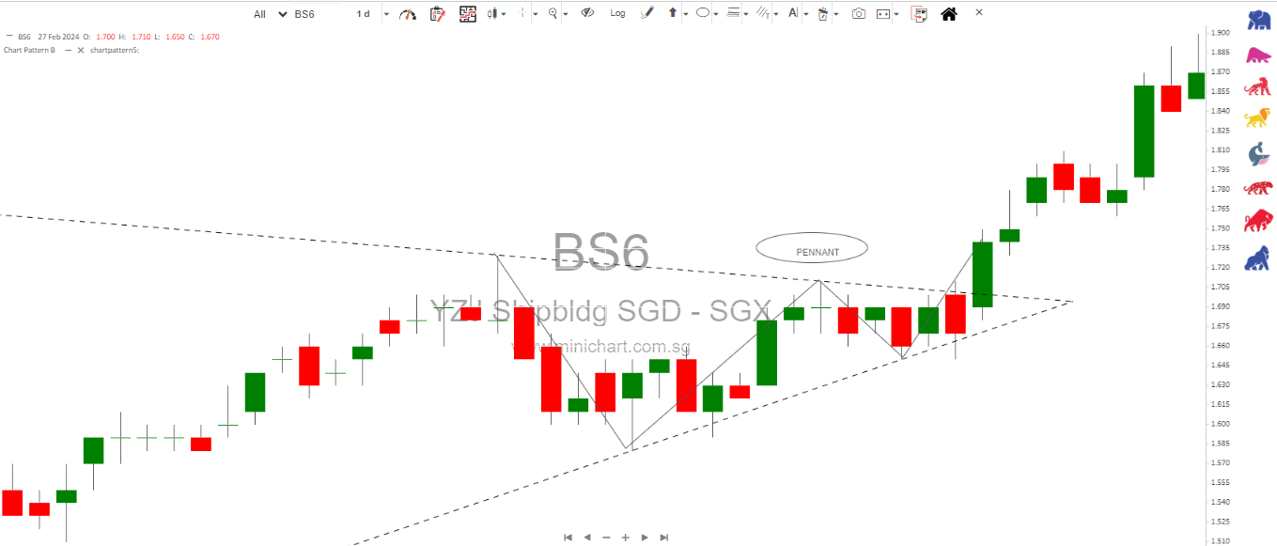
The Pennant Chart Pattern is a powerful continuation pattern used in technical analysis, signalling that a strong trend (upward or downward) is likely to continue after a brief consolidation. Pennants are like flags, but instead of a rectangle, they form a small symmetrical triangle.
Pennants are formed after a significant movement in price (either bullish or bearish) and are characterized by a consolidation period where the price moves within a converging range, followed by a breakout in the direction of the prior trend. The two types of pennants are bullish pennants and bearish pennants.
________________________________________
How Pennant Chart Patterns Work for Buying and Selling
________________________________________
Bullish Pennant:
• Formation: A bullish pennant occurs after a sharp upward price movement, often referred to as the “flagpole” or “mast.” After this upward movement, the price consolidates for a short period in a small triangular range, creating the pennant shape. The pattern ends with a breakout to the upside, signalling the continuation of the bullish trend.
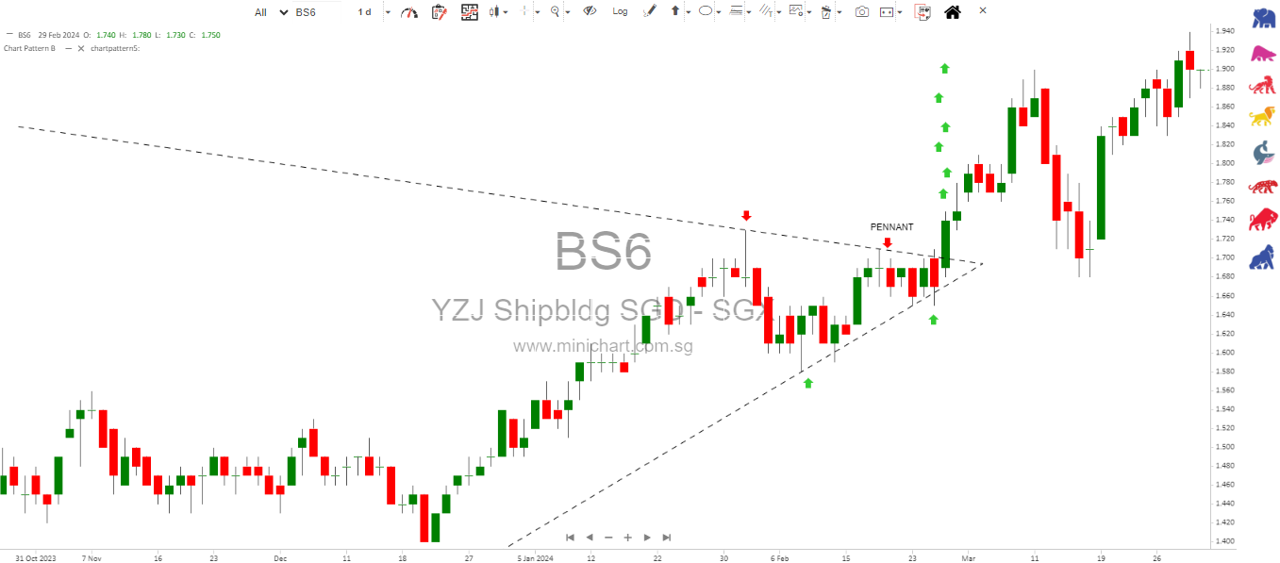
• Buying Signal: A trader would look to buy when the price breaks above the upper trendline of the pennant. The breakout typically signals the continuation of the strong upward movement.
• Selling Signal: Although bullish pennants are primarily continuation patterns, if the price breaks below the lower trendline of the pennant, it can signal a reversal to the downside. In this case, some traders may choose to sell or avoid entering the market.
• Stop-Loss Consideration: A stop-loss can be placed below the lower trendline of the pennant to protect against false breakouts or unexpected reversals. This limits potential losses if the pattern fails.
Bearish Pennant:
• Formation: A bearish pennant forms after a sharp downward price movement. Like the bullish pennant, the price consolidates in a small symmetrical triangle, forming the pennant shape. The pattern is followed by a breakout to the downside, continuing the downward trend.
• Selling Signal: A trader would look to sell when the price breaks below the lower trendline of the pennant. This indicates the continuation of the bearish trend.
• Buying Signal: In rare cases, if the price breaks above the upper trendline of the pennant, it could signal a reversal of the bearish trend, leading to a buying opportunity. However, pennants are generally used as continuation patterns, so this is less common.
• Stop-Loss Consideration: A stop-loss can be placed just above the upper trendline of the pennant to protect against false breakouts or trend reversals.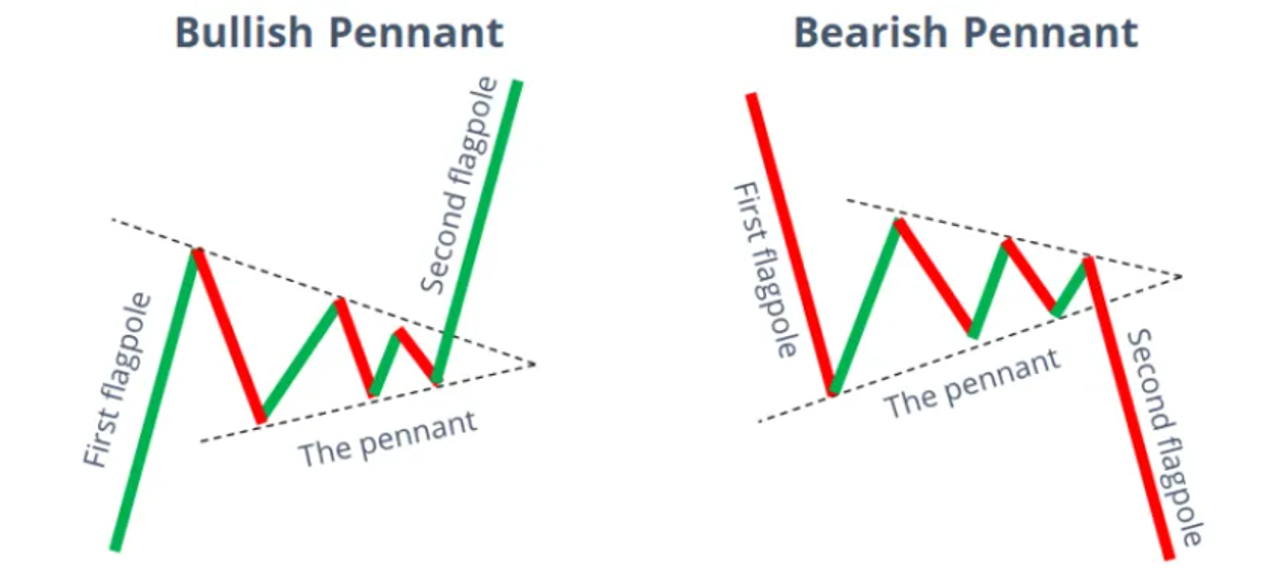
Measuring Price Targets:
• The potential price target after a breakout from a pennant can be estimated by measuring the length of the flagpole (the initial sharp movement) and projecting it in the direction of the breakout from the pennant. This gives traders a rough idea of how far the price could move after the breakout.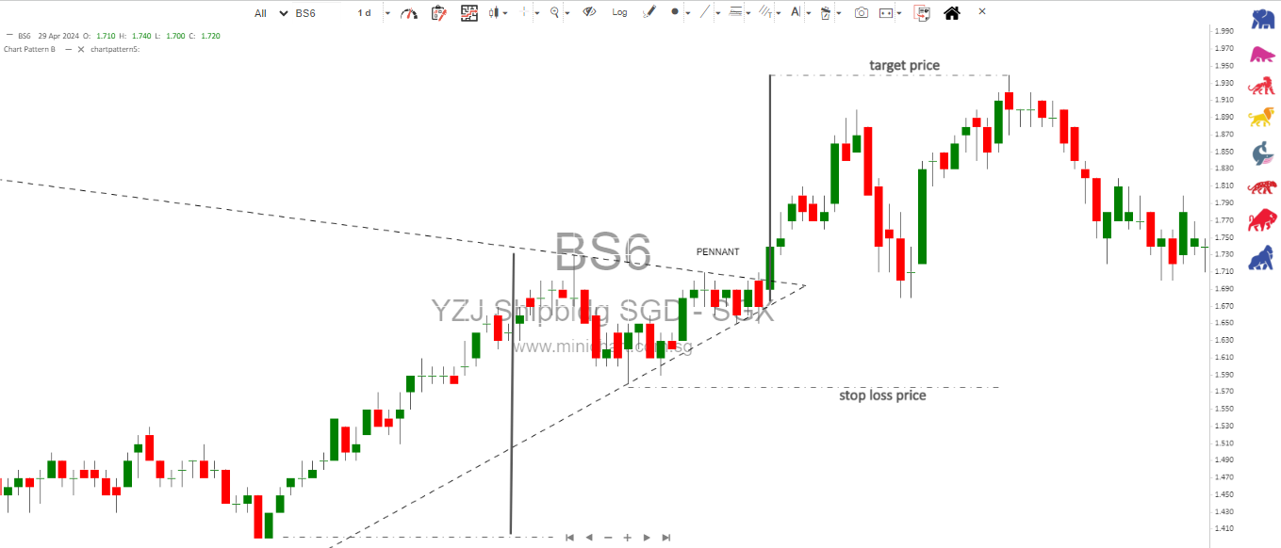
________________________________________
The Psychology Behind Pennant Chart Patterns
________________________________________
The psychology behind pennant patterns reflects the dynamics of supply and demand in the market. After a significant price move (either upward or downward), traders take a brief pause, leading to a period of consolidation where buyers and sellers battle for control.
• Bullish Pennant: After a strong upward move, bullish traders who initially drove the price higher may pause, waiting to see if more buyers will step in. During this period, some traders might take profits, causing the price to consolidate. However, the selling pressure is not strong enough to reverse the trend, and buyers eventually regain control, leading to a breakout above the pennant.
• Bearish Pennant: Similarly, after a sharp downward movement, sellers may take a pause, and the price consolidates within a narrow range. The market is undecided as buyers and sellers battle for control. However, in the case of a bearish pennant, the sellers eventually win the battle, leading to a breakout below the pennant and the continuation of the downtrend.
The consolidation phase in both patterns represents a balance of power between buyers and sellers, but the breakout signals that the trend direction has been reaffirmed by one side taking control.
________________________________________
How chartist Can Use the Pennant Chart Pattern to Invest in the Stock Market
________________________________________
Pennant patterns offer traders and investors excellent opportunities to capitalize on strong trends. Here’s how readers can apply pennant patterns in the stock market:
Trend Continuation Strategy:
o Pennants are continuation patterns, so the most effective way to trade them is to follow the prevailing trend. In a strong bull market, bullish pennants provide excellent entry points for buying the stock or other assets. Similarly, in a bear market, bearish pennants offer good opportunities to short-sell or exit long positions.
o Traders should always wait for a confirmed breakout from the pennant before entering a trade. Jumping in too early during the consolidation phase can lead to losses if the breakout fails to materialize.
Volume Confirmation:
o The most reliable pennant breakouts occur when accompanied by an increase in trading volume. Volume confirmation is critical because it shows that there is strong market participation in the breakout direction. Low-volume breakouts can often lead to false signals.
o To ensure a valid breakout, traders should look for a significant spike in volume when the price breaks above or below the pennant.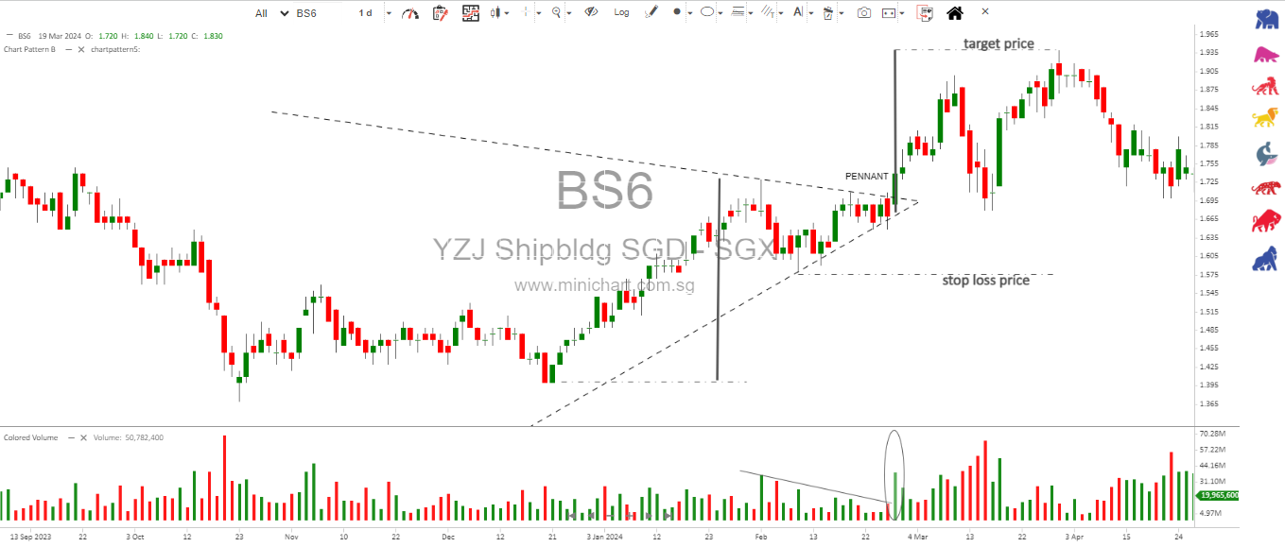
Stop-Loss Orders:
o Pennant patterns, like all technical patterns, are not foolproof. Therefore, it is essential to place stop-loss orders to limit potential losses. For bullish pennants, a stop-loss order can be placed just below the lower trendline, while for bearish pennants, the stop-loss can be placed just above the upper trendline.
o Proper risk management is crucial, as false breakouts can occur in low-volume environments or during periods of market manipulation.
Target Projection:
o A price target can be calculated by measuring the length of the flagpole (the initial sharp move) and projecting it from the breakout point. This allows traders to estimate where the price is likely to go after the breakout and plan their exit strategy.
o For example, if the flagpole is $10 long, the trader might expect the price to move an additional $10 in the direction of the breakout after the pennant pattern resolves.
Swing Trading:
o Pennant patterns are ideal for swing traders because they represent short-term consolidation before a continuation in the trend. Swing traders can capitalize on the momentum created by the breakout and ride the trend for a short period before taking profits.
o Swing traders can also use pennants to set up trailing stop orders to lock in profits as the price moves in their Favor.
Combining Pennants with Other Indicators:
o Pennants are most effective when used in conjunction with other technical analysis tools. For instance, traders can combine pennants with indicators such as the Moving Average (MA) to confirm the trend’s strength, or the MACD (Moving Average Convergence Divergence) to gauge the market’s momentum before the breakout.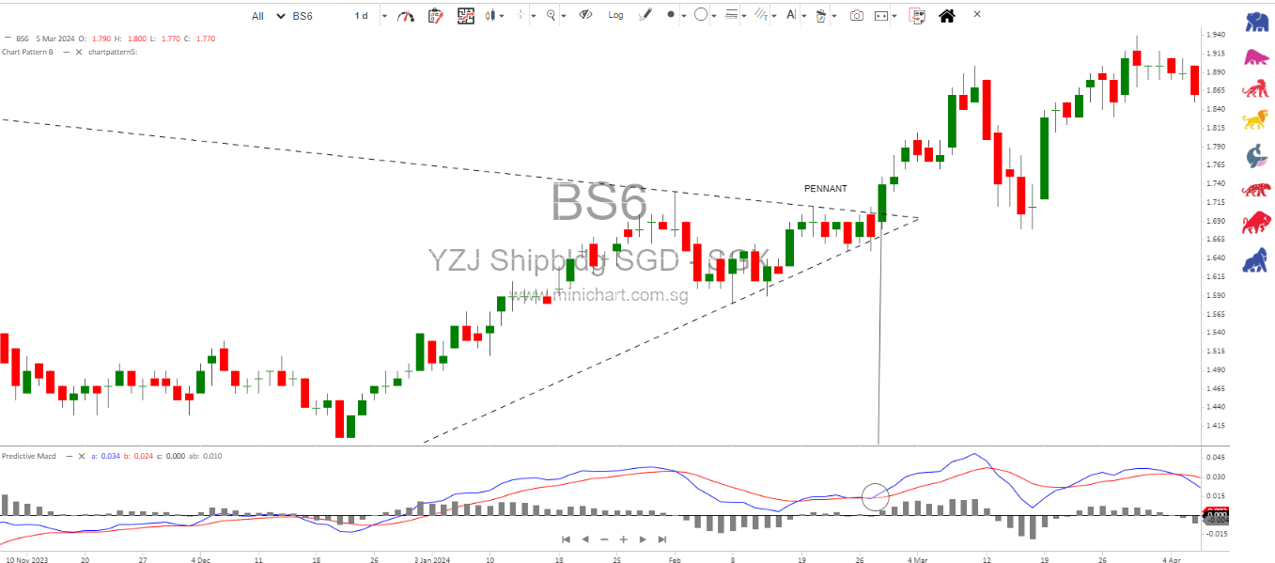
o Additionally, using Fibonacci retracement levels can help identify support or resistance levels near the pennant, which can be used for more precise entries or exits.
________________________________________
Conclusion:
The pennant chart pattern is a reliable and effective continuation pattern in technical analysis, providing traders with actionable signals during periods of consolidation within a strong trend. Whether bullish or bearish, pennants offer clear breakout points and defined risk management opportunities through stop-loss placement. By using volume confirmation, setting realistic price targets, and combining pennant patterns with other technical indicators, traders can significantly enhance their probability of success when investing in the stock market.
