Sunday, September 22nd, 2024

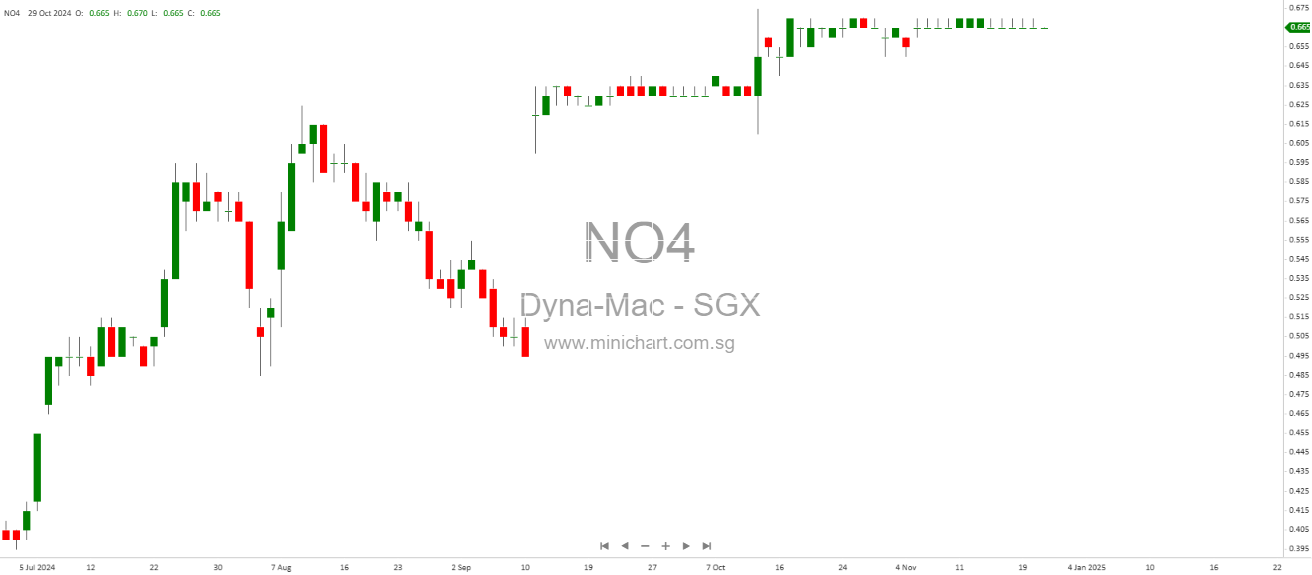
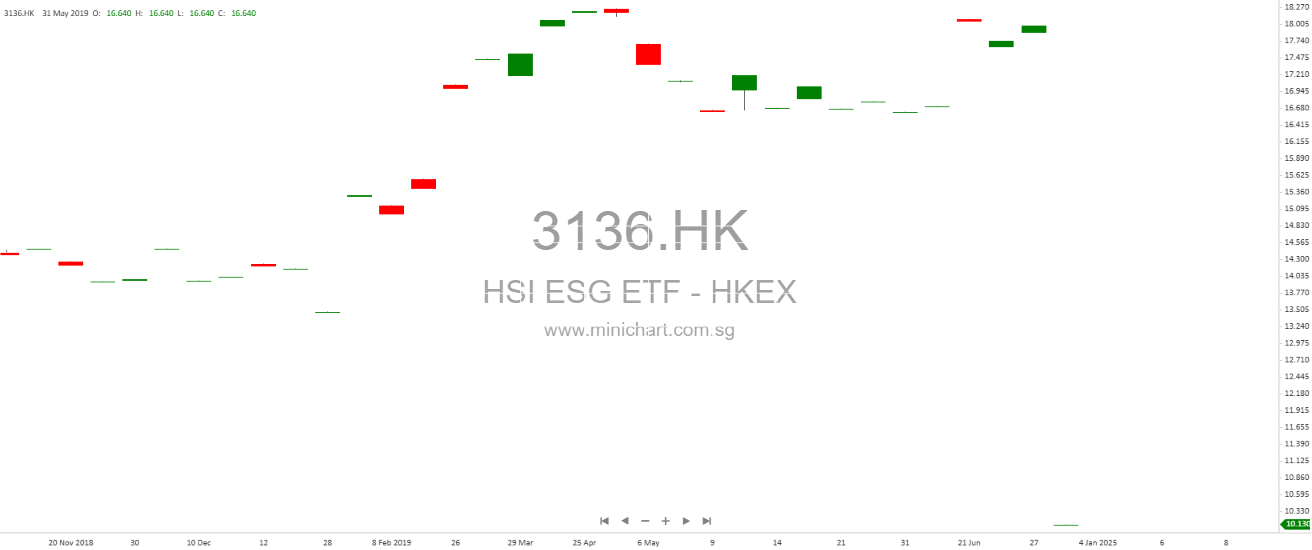
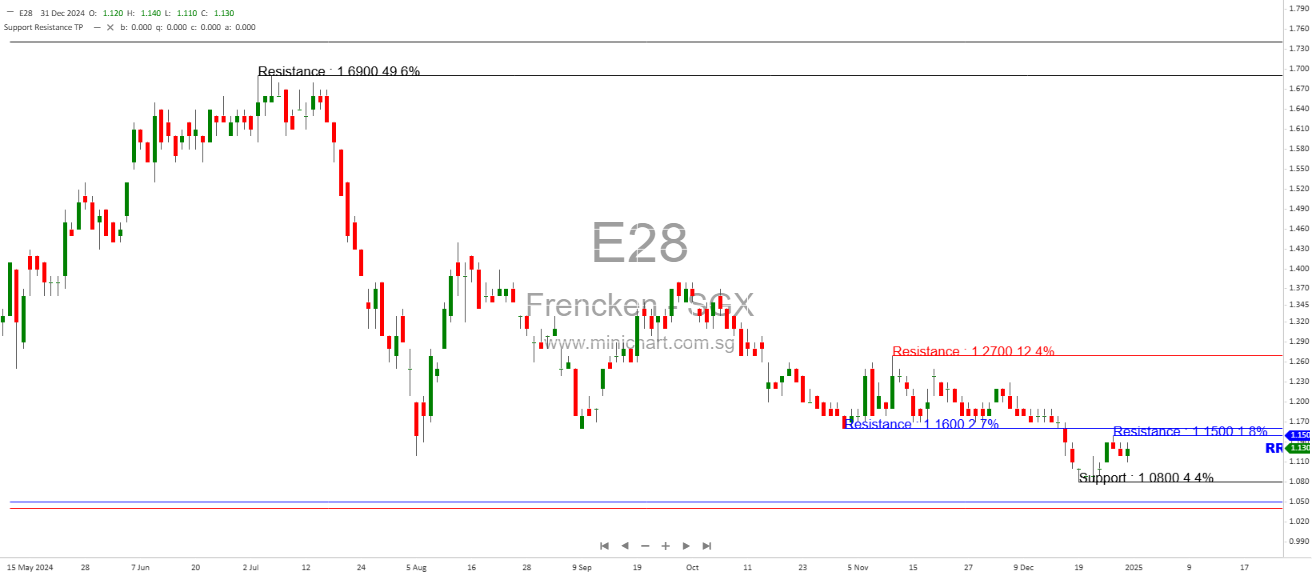
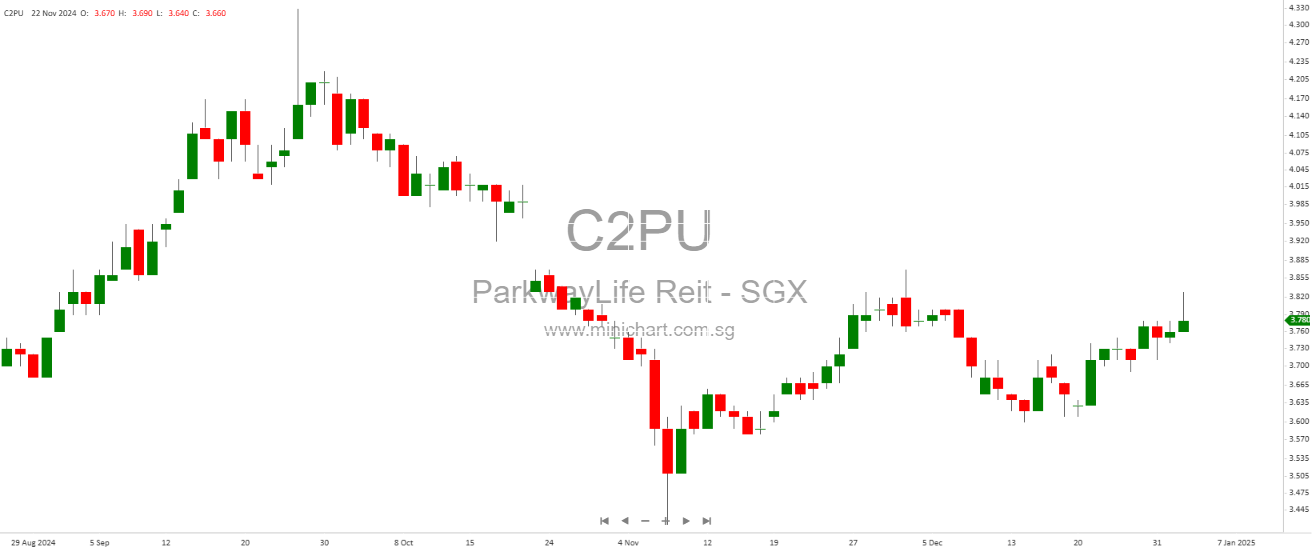
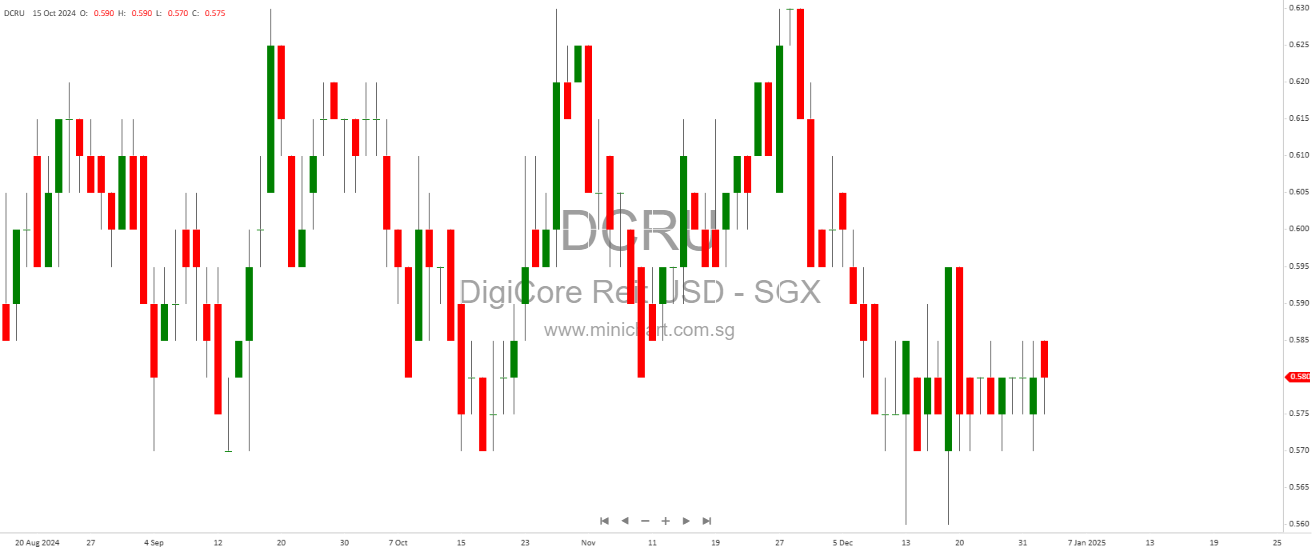
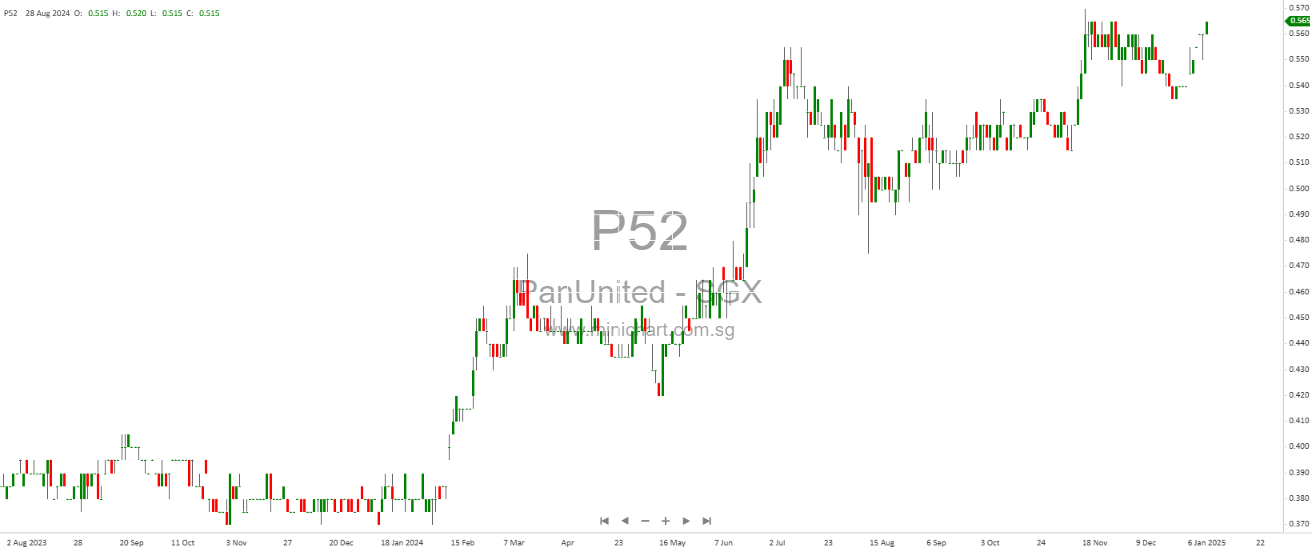
Big White Bar, Big Black Bar, Three White Bars, Three Black Bars, and Gap candlestick

Big White Bar, Big Black Bar, Three White Bars, Three Black Bars, and Gap in Technical Analysis
In technical analysis, candlestick patterns provide essential insights into market sentiment and potential price movements. The Big White Bar, Big Black Bar, Three White Bars, Three Black Bars, and Gaps are all powerful tools that traders use to gauge market strength or weakness and identify potential buying and selling opportunities.
________________________________________
How Each Candlestick Works for Buying and Selling
________________________________________
Big White Bar:
• Formation: A Big White Bar (also known as a Long White Candlestick) is a large bullish candlestick that opens near the low and closes near the high, indicating strong buying momentum. The bigger the candlestick, the more significant the bullish sentiment.
• Buying Signal: A Big White Bar suggests strong buying pressure and a continuation of the upward trend. Traders typically buy if the next candlestick confirms the upward momentum by closing higher.
• Selling Signal: This pattern does not usually offer a selling signal, as it indicates a bullish sentiment. However, traders may consider selling if the next candle is bearish and forms a reversal pattern.
________________________________________
Big Black Bar:
• Formation: A Big Black Bar (also known as a Long Black Candlestick) is a large bearish candlestick that opens near the high and closes near the low, signalling strong selling pressure.
• Buying Signal: A Big Black Bar usually signals the continuation of a downtrend, so it does not typically offer a buying signal. However, if the next candlestick is bullish and forms a reversal pattern, traders may consider buying.
• Selling Signal: A Big Black Bar suggests strong selling pressure, and traders may sell or short-sell if the next candlestick confirms the downtrend by closing lower.
________________________________________
Three White Bars:
• Formation: The Three White Bars pattern consists of three consecutive long white (bullish) candlesticks, each closing higher than the previous one. This pattern shows consistent buying pressure and strong bullish sentiment.
• Buying Signal: This pattern suggests strong buying momentum and a continuation of the uptrend. Traders typically buy after the third white bar, expecting the bullish trend to continue.
• Selling Signal: The pattern does not provide a direct selling signal. However, if the market becomes overextended or shows signs of exhaustion after the three white bars, traders may look for reversal patterns or bearish candlesticks to sell.
________________________________________
Three Black Bars:
• Formation: The Three Black Bars pattern consists of three consecutive long black (bearish) candlesticks, each closing lower than the previous one. This pattern signals strong selling pressure and a bearish market sentiment.
• Buying Signal: This pattern suggests that the market is in a strong downtrend, so it does not typically offer a buying signal. However, if the price forms a bullish reversal pattern after the three black bars, traders may consider buying.
• Selling Signal: The Three Black Bars pattern is a strong sell signal, as it indicates persistent selling pressure. Traders may sell or short-sell after the third black bar, expecting the downtrend to continue.
________________________________________
Gap:
• Formation: A Gap occurs when the price opens significantly higher or lower than the previous closing price, leaving a visible gap between two candlesticks.
There are three main types of gaps:
o Breakaway Gap: Occurs at the beginning of a trend, signaling a new trend direction.
o Continuation Gap (Runaway Gap): Occurs in the middle of a strong trend, signaling that the trend will continue.
o Exhaustion Gap: Occurs near the end of a trend, signaling that the trend may be losing momentum.
• Buying Signal: A gap up (higher open than the previous close) in an uptrend can signal strong buying interest. Traders may buy if the gap is followed by further upward movement, confirming the strength of the trend.
• Selling Signal: A gap down (lower open than the previous close) in a downtrend suggests strong selling pressure. Traders may sell or short sell if the gap is followed by further downward movement, confirming the trend continuation.
________________________________________
The Psychology Behind the Candlesticks
________________________________________
• Big White Bar: This candlestick reflects strong bullish sentiment, where buyers dominate the market, pushing the price higher throughout the session. It signals confidence in the market, with buyers expecting further gains.
• Big Black Bar: The Big Black Bar shows strong bearish sentiment, where sellers control the market, pushing the price lower. It signals fear or pessimism in the market, with sellers expecting more downside.
• Three White Bars: This pattern shows consistent bullish pressure over multiple sessions, indicating that buyers are in control and confident in the continuation of the uptrend.
• Three Black Bars: This pattern reflects persistent selling pressure, where each session closes lower than the previous one. It signals that sellers are firmly in control, and the downtrend is likely to continue.
• Gap: Gaps reflect a sudden shift in market sentiment. A gap up shows that buyers are eager to enter the market at higher prices, while a gap down shows that sellers are in control, driving the price lower. The psychology behind gaps is often linked to news events or changes in market expectations.
________________________________________
How to Use Candlestick Patterns to Invest in the Stock Market
________________________________________
Traders can use these candlestick patterns to identify strong trends, reversals, and potential continuation signals:
• Identify Strong Trends: Patterns like the Big White Bar and Three White Bars indicate strong bullish trends. Traders can buy into the strength, expecting the uptrend to continue.
• Identify Reversals: Patterns like the Big Black Bar and Three Black Bars suggest that the market is in a strong downtrend. Traders can use these patterns to exit long positions or enter short positions.
• Watch for Gaps: Gaps provide powerful signals when accompanied by strong volume and market news. A breakaway gap can signal a new trend, while a continuation gap reinforces an existing trend. Traders should be cautious with exhaustion gaps, as they can indicate the end of a trend.
• Use Stop-Loss Orders: When trading these patterns, always place stop-loss orders to protect against market reversals. For bullish patterns, stop-losses can be placed below the low of the candlestick or pattern, while for bearish patterns, stop-losses can be placed above the high.
________________________________________
How to Combine Candlestick Patterns with Trendlines to Improve Winning Rates
________________________________________
Combining candlestick patterns with trendlines adds context and increases the reliability of trading signals:
• Using Trendlines for Confirmation: When a Big White Bar or Three White Bars form near a trendline, it strengthens the signal, as the trendline acts as support. Similarly, if a Big Black Bar or Three Black Bars form near a trendline, it strengthens the signal that the trendline may act as resistance.
• Using Trendline Breakouts: A Breakaway Gap that coincides with a trendline breakout adds even more weight to the trade, indicating a strong potential for a new trend.
• Trendline Reversals: If a gap forms near a trendline and is followed by a reversal candlestick pattern, such as a Big Black Bar or Three Black Bars, it may signal that the trendline is about to break and the market will reverse.
________________________________________
Suggested Strategy for Candlestick Trading
________________________________________
A robust candlestick trading strategy combines candlestick patterns, trendlines, and other technical indicators:
1. Identify the Trend: Begin by determining the overall market trend using trendlines or moving averages. Ensure that you are trading in the direction of the prevailing trend for better results.
2. Look for Candlestick Patterns at Key Levels: Use candlestick patterns like Big White Bars, Three White Bars, or gaps as continuation signals in an uptrend. Use Big Black Bars, Three Black Bars, or gaps in a downtrend as signals to sell or short-sell.
3. Confirm with Volume and Trendlines: Always confirm the candlestick pattern with volume and trendlines. If a Big White Bar forms near a rising trendline with strong volume, it confirms the uptrend is intact. If a Big Black Bar forms near a falling trendline with increasing volume, it confirms the downtrend is intact.
4. Set Stop-Losses and Targets: Use the high or low of the candlestick as your stop-loss level. For targets, measure the distance from the recent swing low to the current price (for uptrends) or from the recent swing high to the current price (for downtrends).
5. Execute the Trade: Once the candlestick pattern is confirmed, execute the trade. If you are trading a bullish pattern (like Three White Bars), buy at the breakout level. If trading a bearish pattern (like a Big Black Bar), sell or short-sell after confirmation.
6. Use a Trailing Stop: As the price moves in your favor, adjust your stop-loss level to lock in profits. This trailing stop will protect your gains while allowing the trade to continue running if the trend persists.
________________________________________
Conclusion:
Candlestick patterns like the Big White Bar, Big Black Bar, Three White Bars, Three Black Bars, and gaps are powerful indicators of market sentiment and can provide clear signals for entering or exiting trades. By understanding the psychology behind these patterns, confirming them with trendlines and volume, and following a structured trading strategy, traders can improve their success rate in the stock market. Combining these candlestick patterns with trendlines and risk management tools such as stop-losses ensures a well-rounded approach to technical analysis. Thank you