The Triple Top and Triple Bottom patterns are powerful reversal patterns in technical analysis. They indicate that a current trend (either upward or downward) is losing strength and that the price may soon reverse direction. These patterns are considered more reliable than their counterparts, the Double Top and Double Bottom, because they represent more attempts by the market to breach a key level of support or resistance.
How Triple Top and Triple Bottom Patterns Work for Buying and Selling
Triple Top:
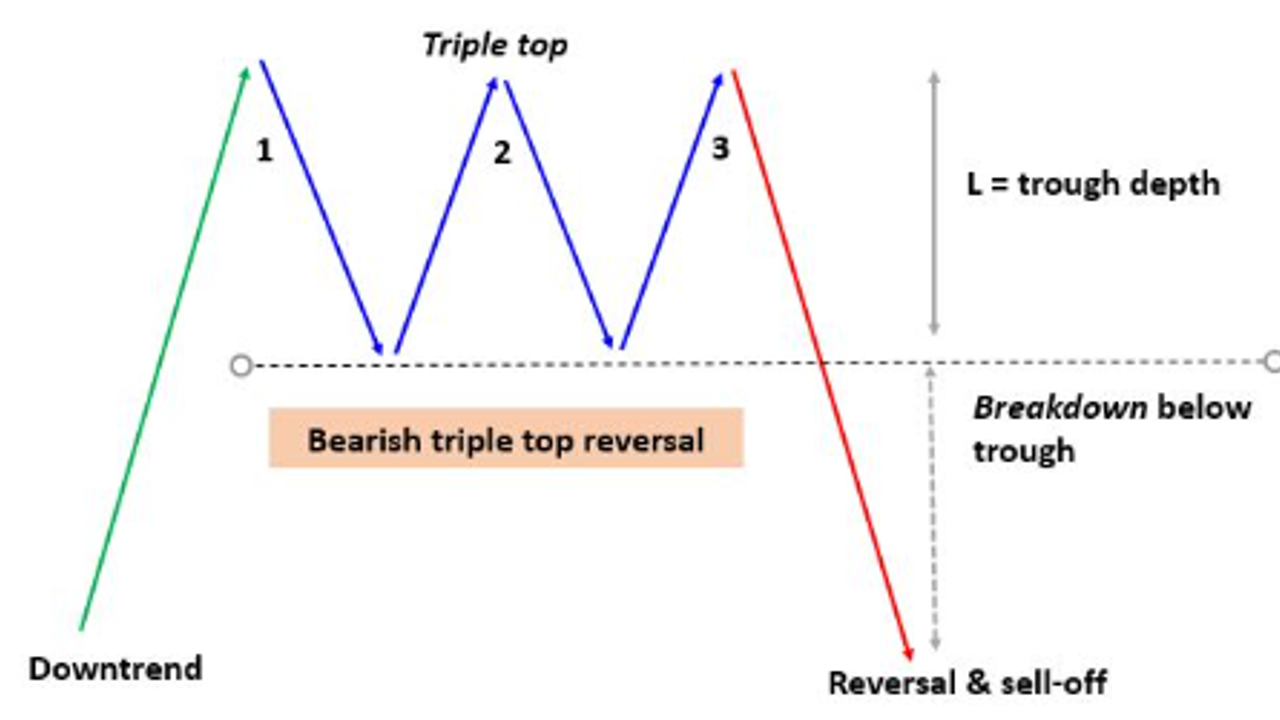
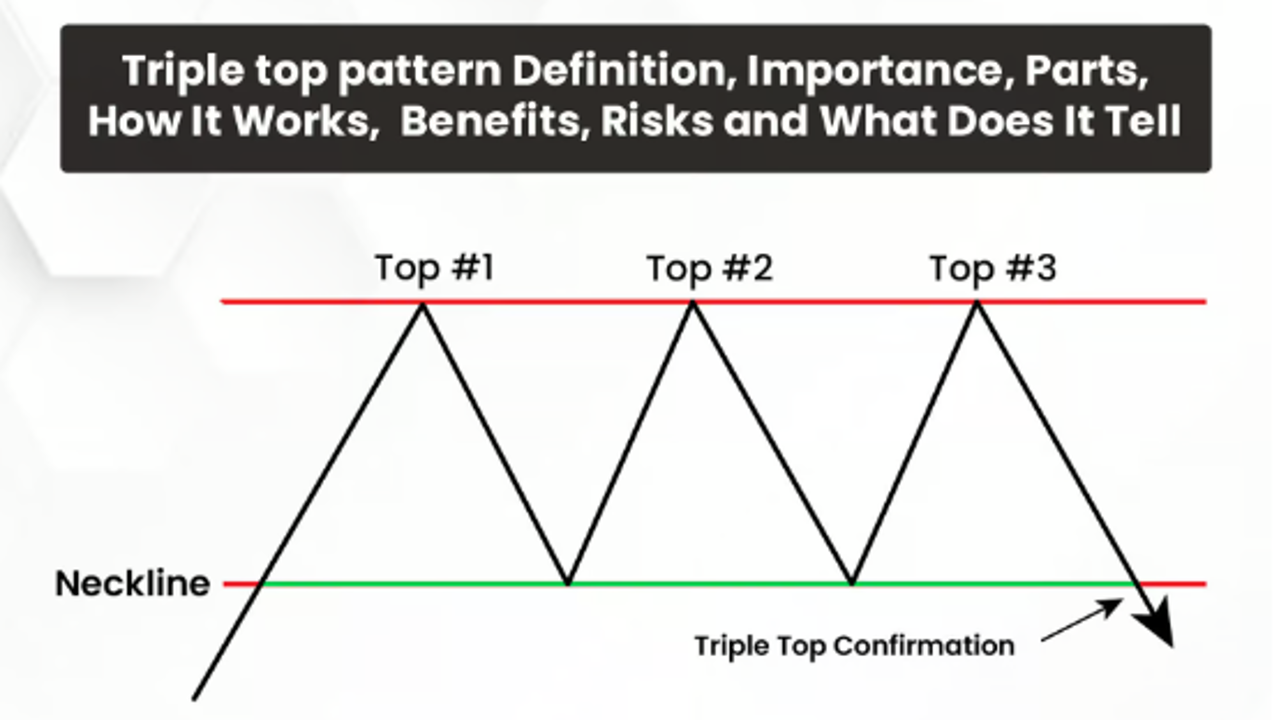
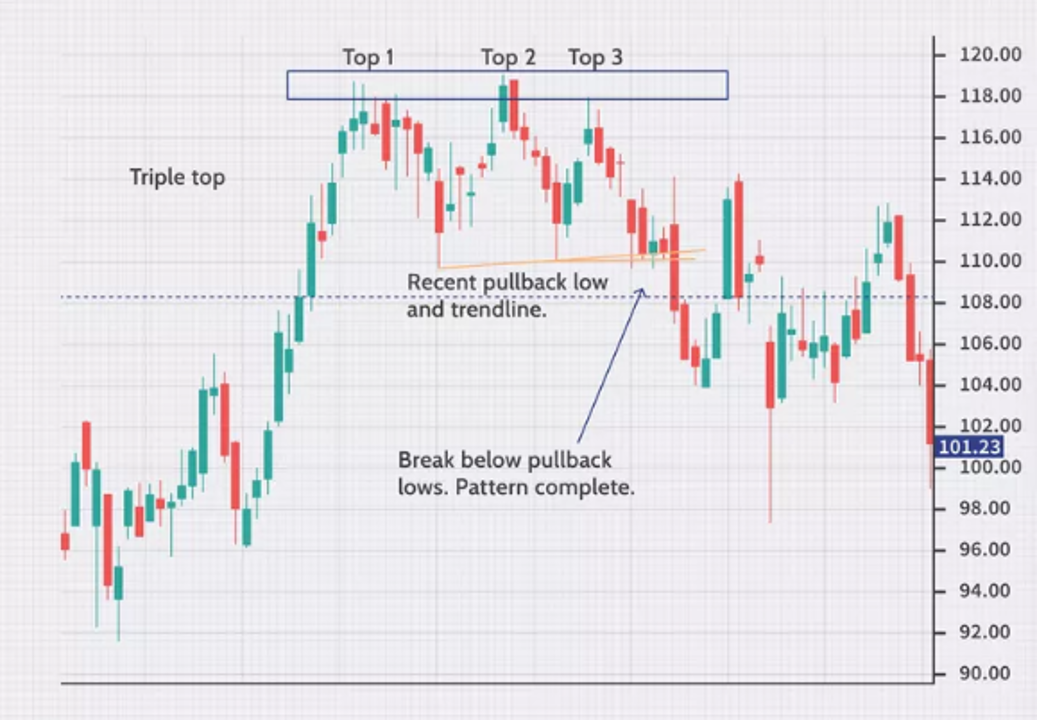
- Formation: The Triple Top pattern forms at the end of an uptrend. It consists of three peaks that occur at roughly the same price level, with two troughs separating them. Each peak represents a point where the price fails to break through a resistance level, signaling that buying pressure is weakening.
- First Peak: The first peak forms as part of the uptrend, but after reaching the resistance level, the price pulls back to form a trough.
- Second Peak: The price rallies again to the same resistance level, but fails to break through and pulls back once more, forming another trough.
- Third Peak: A final rally occurs, but again, the price is unable to break above the resistance level. This repeated failure to break through the resistance indicates that the uptrend is losing momentum.
- Selling Signal: The selling signal is triggered when the price breaks below the support level formed by the two troughs. This breakdown confirms that the bulls have been exhausted, and sellers are now in control, signaling the start of a downtrend. Traders typically enter a short position when the price closes below the support level with high volume.
- Buying Signal: The Triple Top is a bearish reversal pattern, so there isn’t a conventional buying signal. However, some traders might look for a countertrend rally if the price finds strong support after the breakdown and begins to reverse upward. This is a high-risk strategy and should only be taken with caution.
- Stop-Loss Consideration: Traders who short-sell after the breakdown of a Triple Top can place a stop-loss order just above the highest of the three peaks to protect against a failed breakdown or a sudden reversal back into the uptrend.

Triple Bottom:
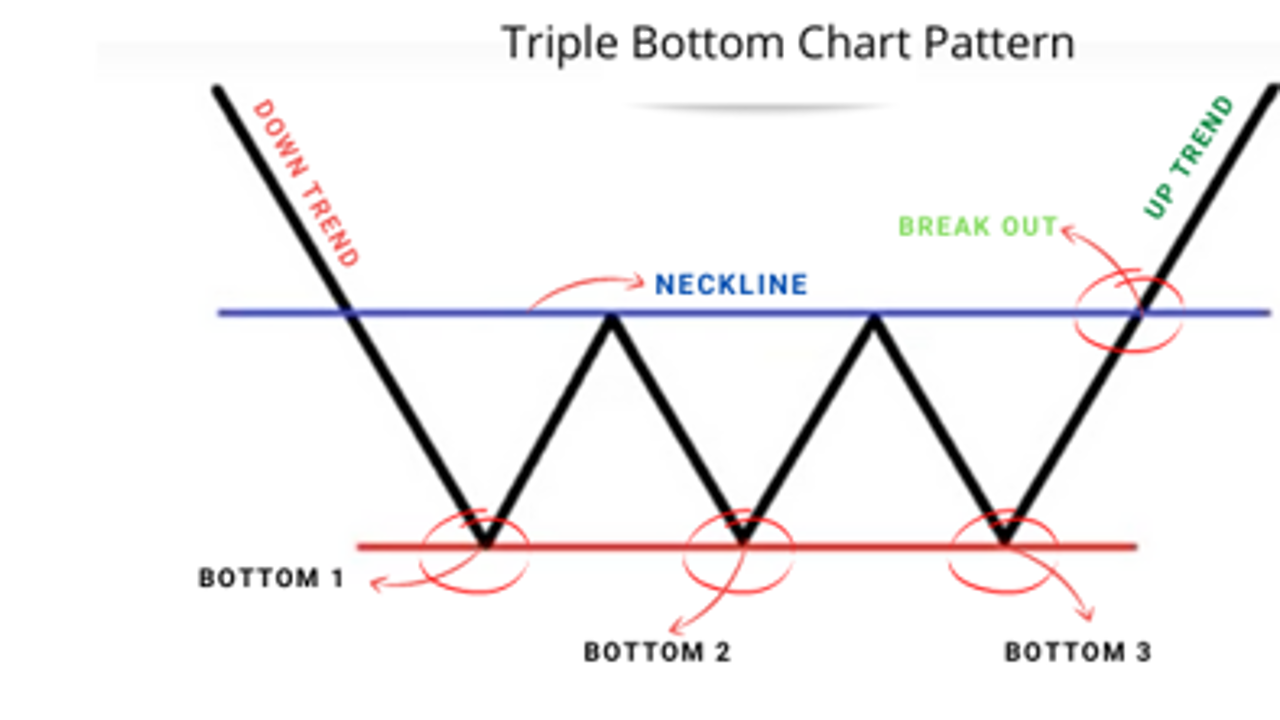
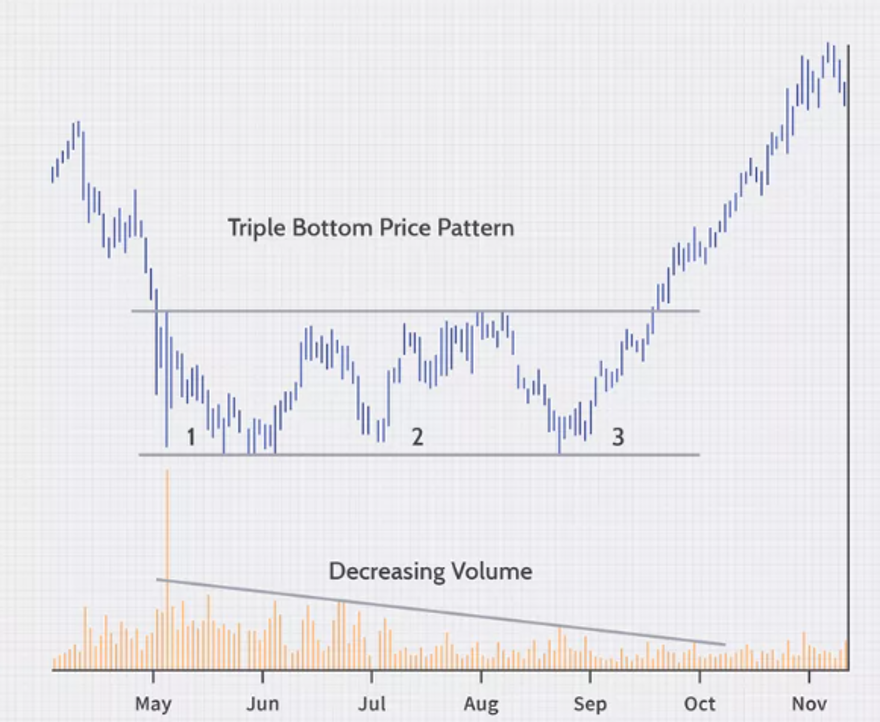
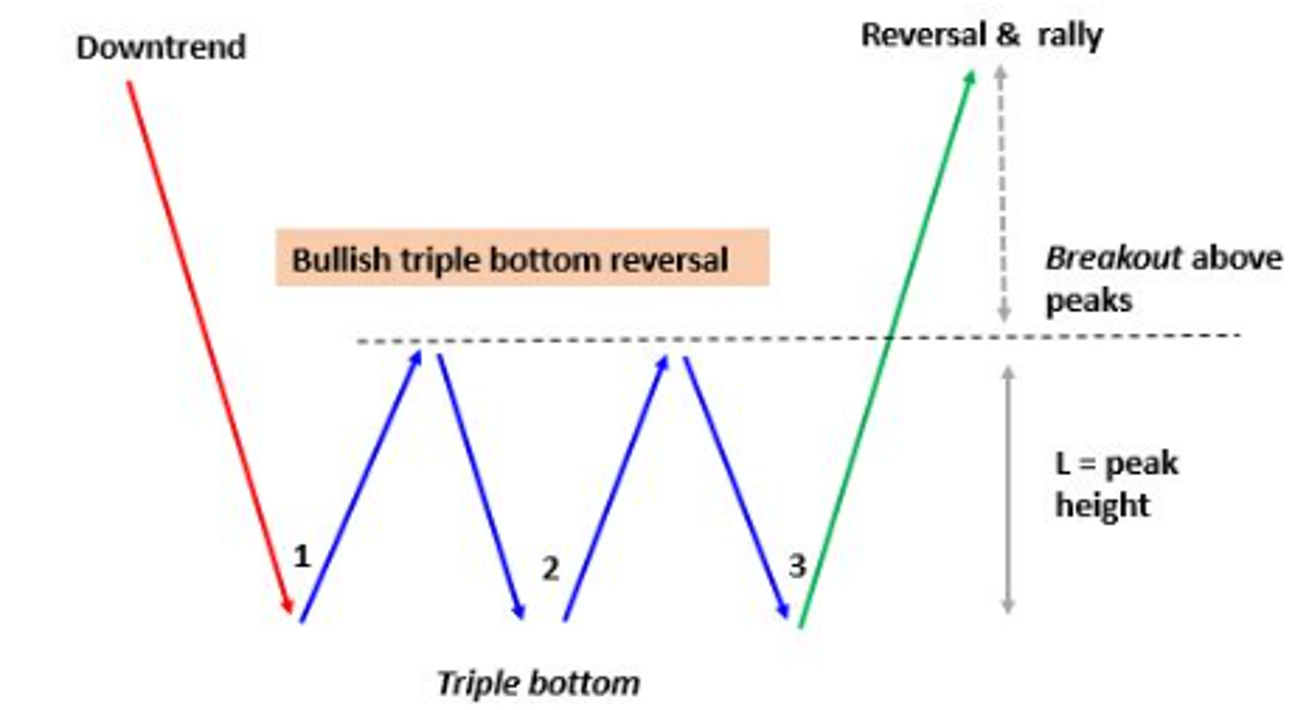
- Formation: The Triple Bottom pattern is the opposite of the Triple Top and forms at the end of a downtrend. It consists of three troughs that occur at roughly the same price level, with two peaks separating them. Each trough represents a point where the price fails to break through a support level, signaling that selling pressure is weakening.
- First Trough: The first trough forms as part of the downtrend, but after reaching the support level, the price rallies to form a peak.
- Second Trough: The price falls again to the same support level, but fails to break below it, signaling that sellers are losing strength. Another rally follows, forming another peak.
- Third Trough: A final decline occurs, but once again, the price is unable to break below the support level. This repeated failure to break through the support indicates that the downtrend is losing momentum.
- Buying Signal: The buying signal is triggered when the price breaks above the resistance level formed by the two peaks. This breakout confirms that the bears have been exhausted, and buyers are now in control, signaling the start of an uptrend. Traders typically enter a long position when the price closes above the resistance level with high volume.
- Selling Signal: The Triple Bottom is a bullish reversal pattern, so there isn’t a conventional selling signal. However, if the price fails to break above the resistance level and starts to fall back below the support level, traders may consider selling or shorting the asset.
- Stop-Loss Consideration: Traders who buy after the breakout of a Triple Bottom can place a stop-loss order just below the lowest of the three troughs to protect against a failed breakout or a sudden reversal back into the downtrend.
Measuring Price Targets:
- In both patterns, the potential price target after a breakout (Triple Bottom) or breakdown (Triple Top) can be estimated by measuring the distance between the support and resistance levels and projecting that distance from the breakout or breakdown point. This gives traders a rough idea of how far the price might move after the pattern is completed.
The Psychology Behind Triple Top and Triple Bottom Patterns
The psychology behind the Triple Top and Triple Bottom patterns reflects the market’s struggle between buyers and sellers at key levels of support or resistance. Understanding the psychological dynamics can help traders better interpret price action.
Triple Top Psychology:
- First Peak: During the uptrend, buyers push the price higher to a resistance level. However, after reaching this level, some traders begin to take profits, causing the price to pull back. The pullback is typically seen as a normal correction, and buyers may expect the uptrend to continue.
- Second Peak: The price rallies again to the same resistance level, but the buying pressure is not strong enough to push the price higher. This second failure to break through the resistance level indicates that the bulls are weakening, and more traders start to exit their positions.
- Third Peak: A final rally occurs, but once again, the price is unable to break through the resistance level. At this point, most traders recognize that the uptrend is losing strength, and the repeated failures signal that a reversal is likely.
- Breakout (Bearish Reversal): When the price breaks below the support level, it confirms that the bulls have been exhausted, and sellers have taken control. The market sentiment shifts from bullish to bearish, signaling the start of a downtrend.
Triple Bottom Psychology:
- First Trough: During the downtrend, sellers push the price lower to a support level. However, after reaching this level, some traders begin to take profits from their short positions, causing the price to rally. The rally is typically seen as a normal correction, and sellers may expect the downtrend to continue.
- Second Trough: The price falls again to the same support level, but the selling pressure is not strong enough to push the price lower. This second failure to break through the support level indicates that the bears are weakening, and more traders start to close their short positions.
- Third Trough: A final decline occurs, but once again, the price is unable to break through the support level. At this point, most traders recognize that the downtrend is losing strength, and the repeated failures signal that a reversal is likely.
- Breakout (Bullish Reversal): When the price breaks above the resistance level, it confirms that the bears have been exhausted, and buyers have taken control. The market sentiment shifts from bearish to bullish, signaling the start of an uptrend.
How to Use Triple Top and Triple Bottom Patterns to Invest in the Stock Market
- Identifying Major Trend Reversals:
- Triple Top (Bearish Reversal): Traders can use the Triple Top pattern to identify when an uptrend is about to reverse. After the price breaks below the support level, traders can enter short positions, expecting the price to decline further as the downtrend begins.
- Triple Bottom (Bullish Reversal): Traders can use the Triple Bottom pattern to identify when a downtrend is about to reverse. After the price breaks above the resistance level, traders can enter long positions, expecting the price to rise further as the uptrend begins.
- Volume Confirmation:
- Volume confirmation is critical in both patterns to ensure that the breakout (Triple Bottom) or breakdown (Triple Top) is valid. Traders should look for a significant increase in volume when the price breaks the support or resistance level, as this indicates strong market participation and reduces the risk of a false signal.
- Stop-Loss Orders:
- Triple Top: Traders can place stop-loss orders just above the highest of the three peaks to protect against a failed breakdown or a sudden reversal back into the uptrend.
- Triple Bottom: Traders can place stop-loss orders just below the lowest of the three troughs to protect against a failed breakout or a sudden reversal back into the downtrend.
- Target Projection:
- Traders can estimate a price target by measuring the height of the pattern (the distance between the support and resistance levels) and projecting that distance from the breakout or breakdown point. This helps traders set realistic profit-taking targets.
- Swing Trading:
- The Triple Top and Triple Bottom patterns are ideal for swing traders, as they signal significant reversals in price trends. Swing traders can enter positions at the breakout or breakdown point and ride the new trend for a medium-term period before taking profits.
- Swing traders may also use trailing stop orders to lock in profits as the price moves in their favor.
- Combining with Other Indicators:
- The Triple Top and Triple Bottom patterns are most effective when used in conjunction with other technical indicators. For example, traders can combine these patterns with the RSI (Relative Strength Index) to determine whether the market is overbought (Triple Top) or oversold (Triple Bottom) before entering a trade.
- Moving averages can help confirm the trend direction, and the MACD (Moving Average Convergence Divergence) indicator can be used to assess the strength of the momentum behind the breakout or breakdown.
- Day Trading:
- Although these patterns typically develop over longer periods, they can also be used for day trading on shorter timeframes. Day traders can capitalize on the quick price movements that often follow a breakout (Triple Bottom) or breakdown (Triple Top), but they must manage risk tightly by using stop-loss orders and setting realistic price targets.
Conclusion:
The Triple Top and Triple Bottom chart patterns are reliable reversal patterns that provide traders with clear entry and exit signals when a trend is about to reverse. Whether you’re trading stocks, forex, or other assets, understanding how to recognize these patterns and trade breakouts or breakdowns can significantly enhance your success in the market. By using volume confirmation, setting appropriate stop-loss orders, and combining these patterns with other technical indicators, traders can capitalize on trend reversals with confidence.