The Round Top and Round Bottom chart patterns, also known as Rounding Top and Rounding Bottom, are gradual reversal patterns that signal a potential change in trend direction. These patterns represent the slowing of a current trend and the eventual transition to a new one. They are particularly valuable in technical analysis because they often provide early warnings of trend reversals.
Round Top: A bearish reversal pattern that signals a transition from an uptrend to a downtrend.
Round Bottom: A bullish reversal pattern that signals a transition from a downtrend to an uptrend.
These patterns develop over a longer period, making them useful for swing traders and long-term investors looking for major market reversals.
How Round Top and Round Bottom Chart Patterns Work for Buying and Selling
Round Top:
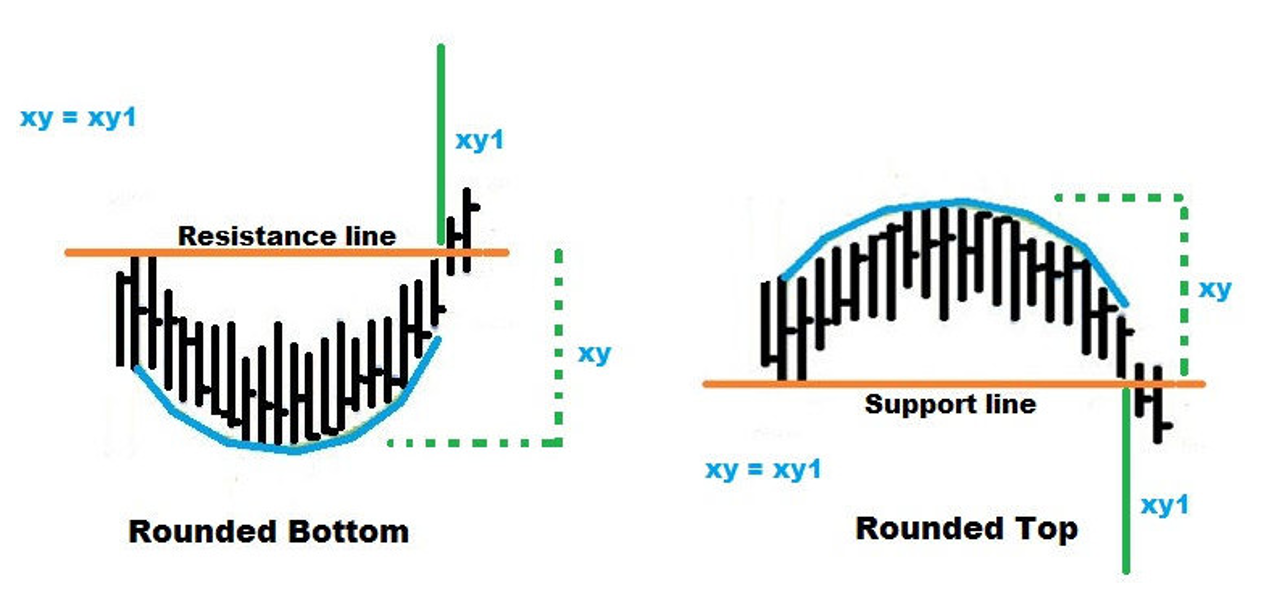
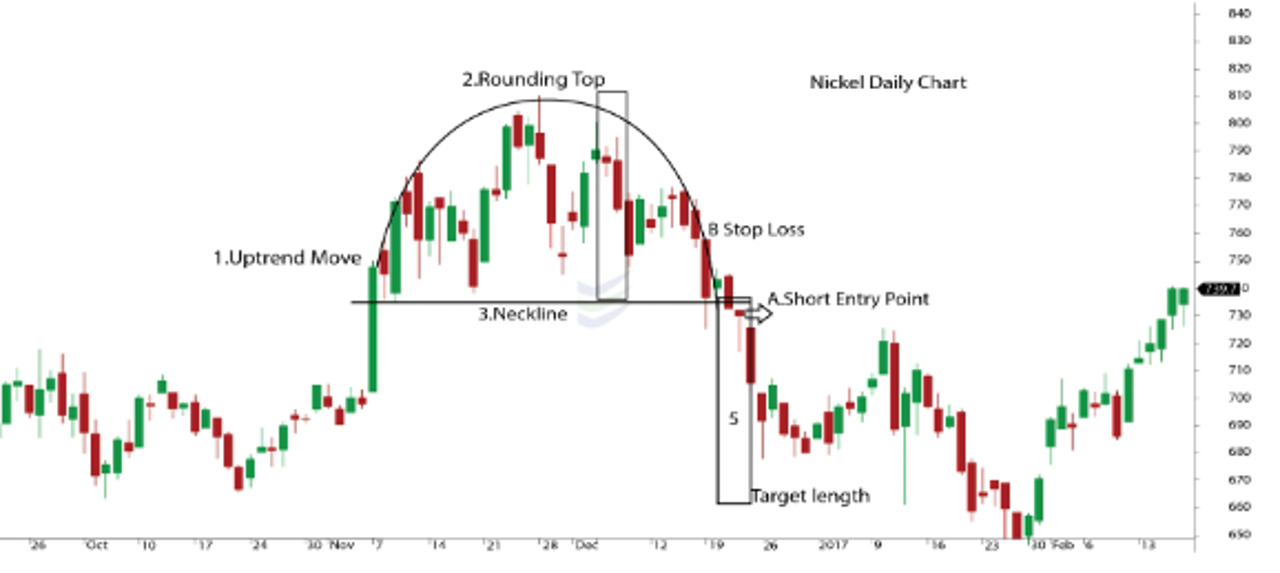
Formation: The Round Top pattern forms during an uptrend. It starts with a gradual increase in price, followed by a peak and then a gradual decrease. This results in a rounded appearance. The rounded top forms as the market transitions from a bullish phase to a bearish phase. The pattern indicates that the buying pressure is slowly weakening, and sellers are starting to take control.
Buying and Selling Dynamics: The price increases gradually, forming the left side of the “round.” Eventually, the price stalls at the peak, and then selling pressure gradually takes over, causing the price to start falling, completing the right side of the “round.”
Selling Signal: The sell signal occurs when the price breaks below the support level that forms at the beginning of the round (where the upward price movement initially started). This confirms that the market has shifted from bullish to bearish sentiment and that a downtrend is likely to begin.
Buying Signal: The Round Top is primarily a bearish pattern, so there isn’t a conventional buying signal. However, after the price reaches a new low and if there is strong support, some traders may look for potential buying opportunities, but these are considered risky unless confirmed by other indicators.
Stop-Loss Consideration: Traders who short-sell after a Round Top breakout should place a stop-loss order just above the high point of the rounding pattern to protect against a failed breakout or reversal.
Round Bottom:
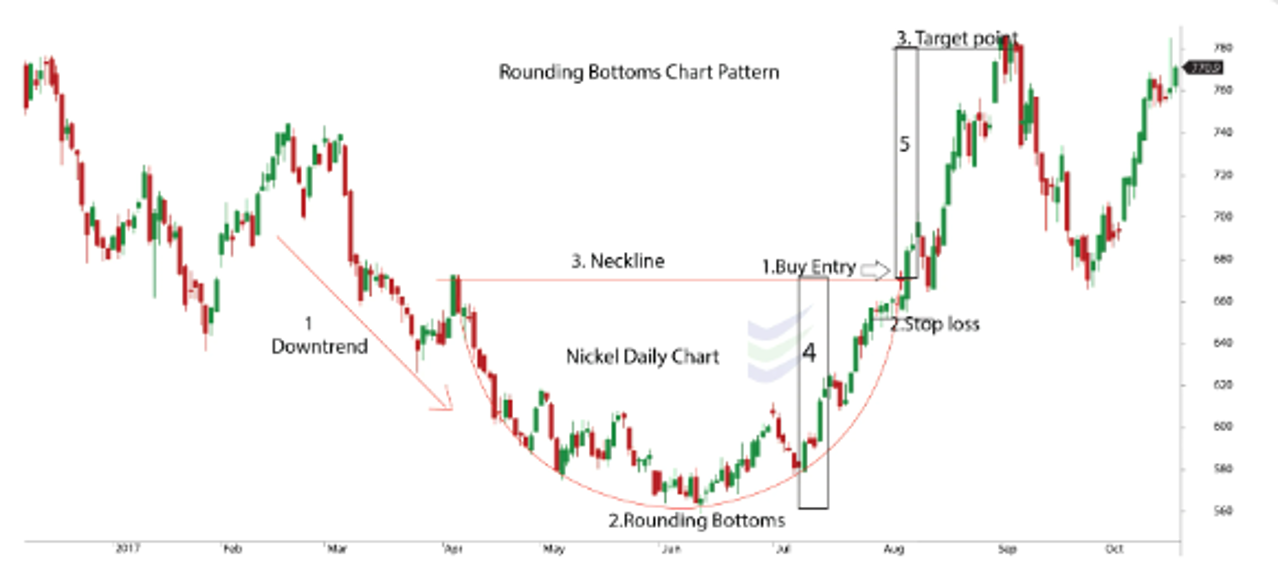
Formation: The Round Bottom pattern is the opposite of the Round Top. It forms during a downtrend and starts with a gradual decrease in price, followed by a low point, and then a gradual increase in price. This results in a rounded appearance. The rounded bottom forms as the market transitions from a bearish phase to a bullish phase. The pattern indicates that selling pressure is weakening, and buyers are starting to take control.
Buying and Selling Dynamics: The price decreases gradually, forming the left side of the “round.” Eventually, the price stalls at the low point, and then buying pressure gradually takes over, causing the price to start rising, completing the right side of the “round.”
Buying Signal: A buy signal occurs when the price breaks above the resistance level that forms at the beginning of the round (where the downward price movement initially started). This confirms that the market has shifted from bearish to bullish sentiment and that an uptrend is likely to begin.
Selling Signal: The Round Bottom is primarily a bullish pattern, so there isn’t a conventional selling signal. However, if the price fails to break above the resistance level or falls back below the support level, traders may consider selling or avoiding a long position.
Stop-Loss Consideration: Traders who buy after a Round Bottom breakout should place a stop-loss order just below the low point of the rounding pattern to protect against a failed breakout or reversal.
Measuring Price Targets:
The potential price target for both patterns can be estimated by measuring the height of the pattern (the distance from the highest point of the round to the lowest point in the case of a Round Top, or the reverse for a Round Bottom) and projecting that distance from the breakout point.
The Psychology Behind Round Top and Round Bottom Patterns
The psychology behind Round Top and Round Bottom patterns reflects a gradual shift in market sentiment. Unlike sharp reversal patterns like Double Tops or Head and Shoulders, these patterns develop slowly, indicating a gradual transition in control between buyers and sellers.
Round Top Psychology:
Gradual Shift from Buying to Selling Pressure: In a Round Top, buyers are initially in control, and the price increases gradually. However, as the price approaches the peak, buying momentum starts to slow. Traders begin to take profits, and fewer buyers are willing to enter the market at the high price levels. This results in the price stalling at the top. As sellers start to dominate, the price gradually declines, completing the rounded shape.
Breakout (Bearish): When the price breaks below the support level formed at the beginning of the round, it confirms that the market has fully transitioned from bullish to bearish. Sellers have taken control, and the pattern signals the start of a downtrend.
Round Bottom Psychology:
Gradual Shift from Selling to Buying Pressure: In a Round Bottom, sellers are initially in control, and the price decreases gradually. However, as the price approaches the low, selling momentum starts to slow. Traders begin to take profits from short positions, and fewer sellers are willing to enter the market at the low price levels. This results in the price stalling at the bottom. As buyers start to dominate, the price gradually rises, completing the rounded shape.
Breakout (Bullish): When the price breaks above the resistance level formed at the beginning of the round, it confirms that the market has fully transitioned from bearish to bullish. Buyers have taken control, and the pattern signals the start of an uptrend.
In both cases, the patterns reflect a gradual transfer of control between buyers and sellers, leading to a breakout in the opposite direction of the prior trend.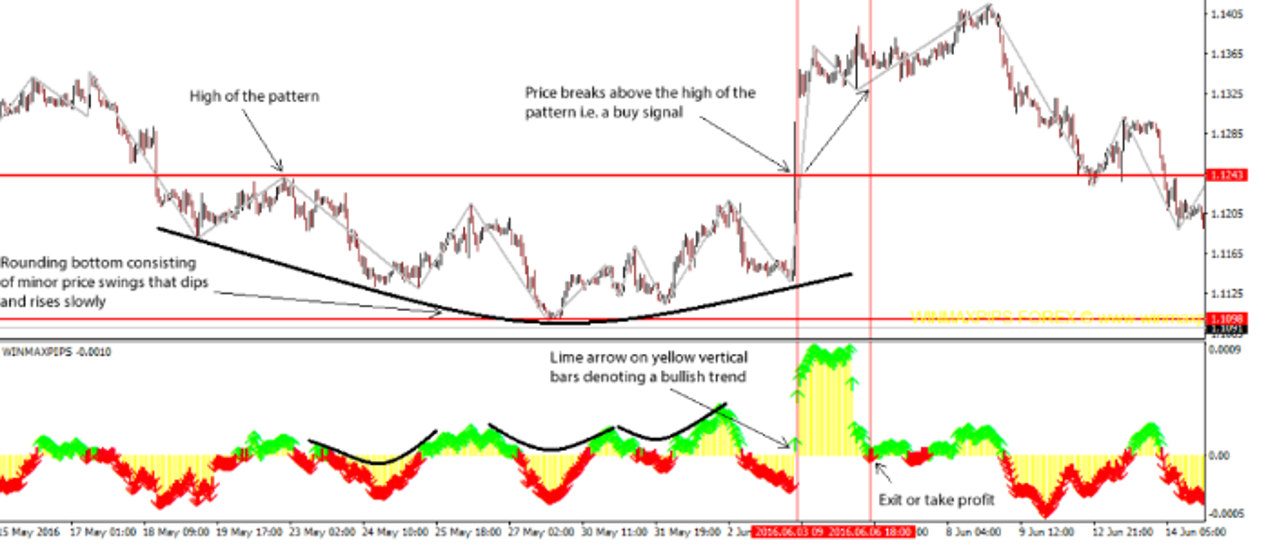
How to Use Round Top and Round Bottom Patterns to Invest in the Stock Market
Round Top and Round Bottom patterns provide traders with valuable signals for entering or exiting trades at key turning points in the market. Here’s how readers can apply these patterns in stock market trading:
Identifying Major Trend Reversals:
Both Round Top and Round Bottom patterns are reversal patterns that signal a gradual change in market direction. Traders can use these patterns to identify major shifts in trends. In an uptrend, a Round Top can signal a transition to a downtrend, while in a downtrend, a Round Bottom can signal a transition to an uptrend.
Traders should wait for the price to break the key support (Round Top) or resistance (Round Bottom) level before entering a trade, as this confirms the reversal.
Volume Confirmation:
A reliable breakout from either pattern is often accompanied by an increase in trading volume. Volume confirmation is critical because it indicates strong market participation in the breakout direction.
For example, a breakout from a Round Bottom accompanied by rising volume is a strong signal that the price is likely to continue upward. Conversely, a breakout from a Round Top with rising volume is a strong signal that the price is likely to continue downward.
Stop-Loss Orders:
Proper risk management is crucial when trading Round Top and Round Bottom patterns. Traders should always use stop-loss orders to limit potential losses. For a Round Top, the stop-loss can be placed just above the high point of the rounding pattern, while for a Round Bottom, the stop-loss can be placed just below the low point of the rounding pattern.
This ensures that if the breakout fails or the trend reverses, losses are minimized.
Target Projection:
A price target can be calculated by measuring the height of the pattern (from the peak to the trough) and projecting that distance from the breakout point. This gives traders a rough idea of how far the price is likely to move after the breakout and helps them set realistic profit-taking targets.
Swing Trading:
Round Top and Round Bottom patterns are ideal for swing traders who look for major reversals in price trends. Swing traders can enter positions at the breakout point and ride the new trend for a longer period before taking profits.
Traders may also use trailing stop orders to lock in profits as the price moves in their favor. Combining with Other Indicators:
Round Top and Round Bottom patterns work best when used in conjunction with other technical indicators. For example, traders can combine these patterns with momentum indicators like the RSI (Relative Strength Index) to determine whether the market is overbought (Round Top) or oversold (Round Bottom) before entering a trade.
Moving averages can also help confirm the strength of the trend reversal, and the MACD (Moving Average Convergence Divergence) can be used to assess the momentum behind the breakout.
7. Long-Term Investing:
Round Top and Round Bottom patterns develop over longer periods, making them useful for long-term investors who are looking to enter or exit significant positions. These patterns can signal long-term shifts in market sentiment, making them valuable tools for timing major trades in stocks or other financial assets.
Conclusion:
The Round Top and Round Bottom chart patterns are reliable reversal patterns that provide traders with early signals of a change in trend direction. Whether you’re trading stocks, forex, or other assets, understanding how to recognize these patterns and trade breakouts can significantly enhance your success in the market. By using volume confirmation, setting appropriate stop-loss orders, and combining these patterns with other technical indicators, traders can capitalize on major trend reversals with confidence.
Thank you
