The Cup and Handle and Inverted Cup and Handle patterns are popular chart patterns in technical analysis that signal potential trend continuations or reversals. The Cup and Handle pattern is typically a bullish continuation pattern, while the Inverted Cup and Handle is a bearish reversal pattern. Both patterns provide traders with clear entry points, stop-loss levels, and price targets.
How Cup and Handle and Inverted Cup and Handle Chart Patterns Work for Buying and Selling
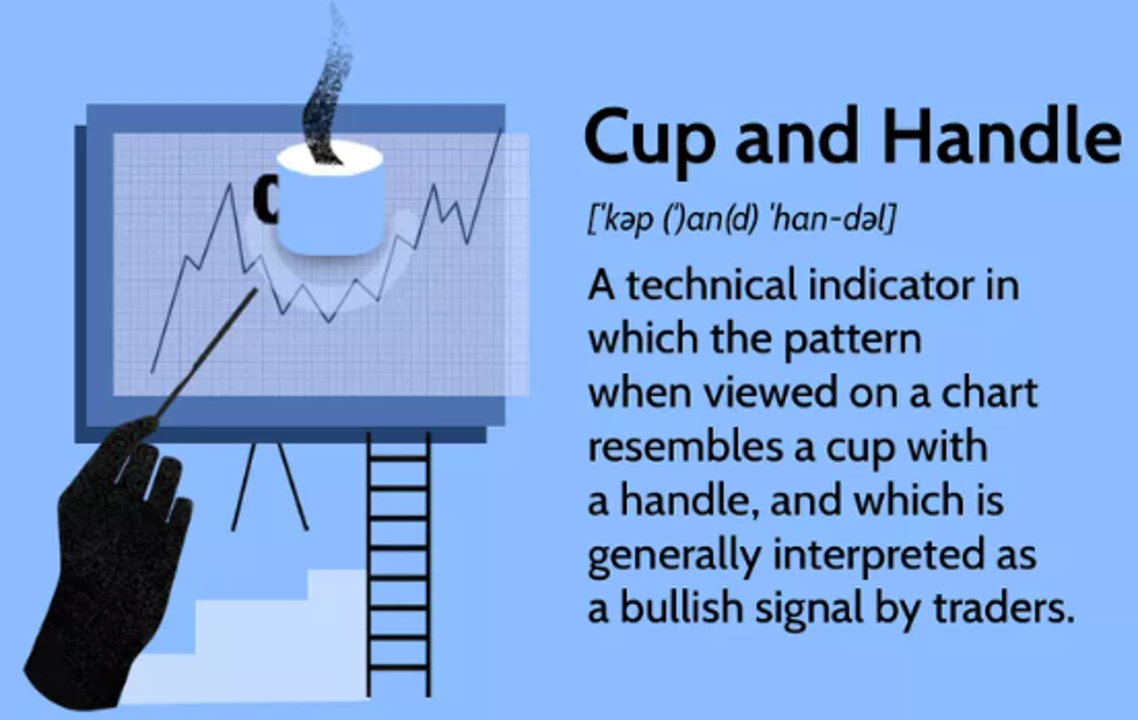
Cup and Handle:
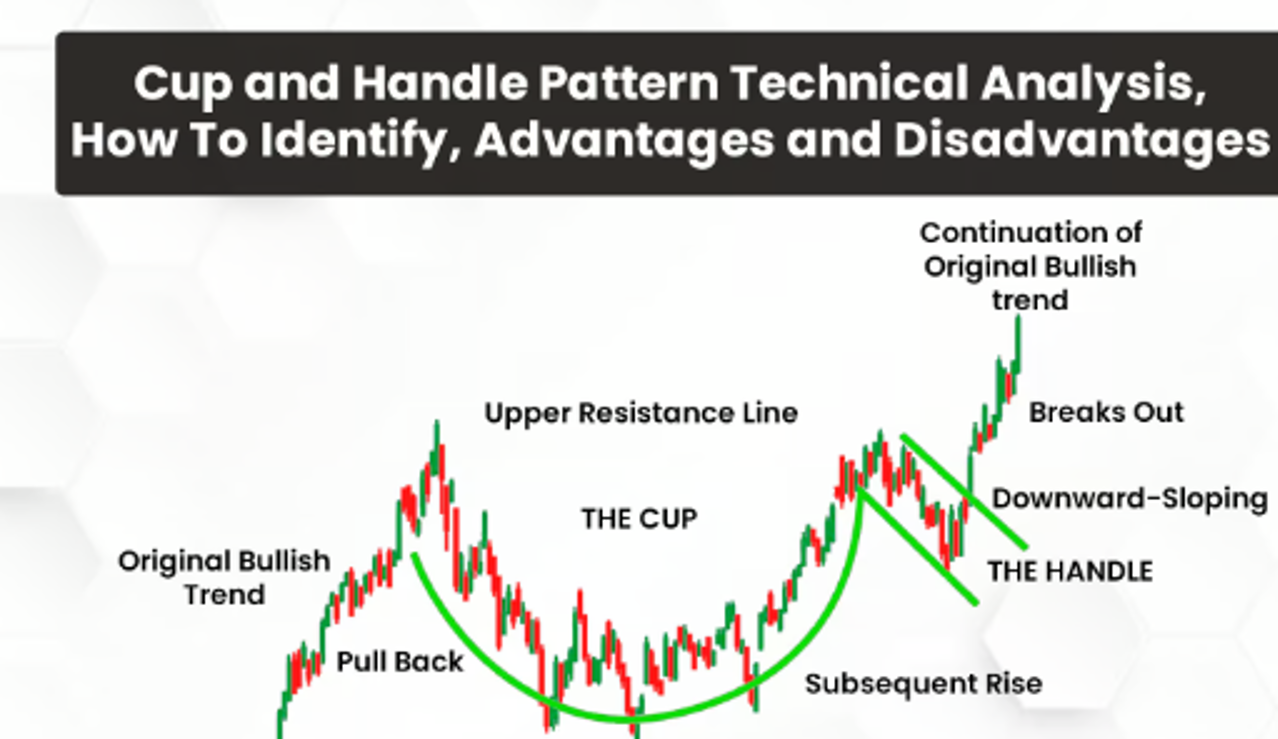
- Formation: The Cup and Handle pattern forms during an uptrend and consists of two parts:
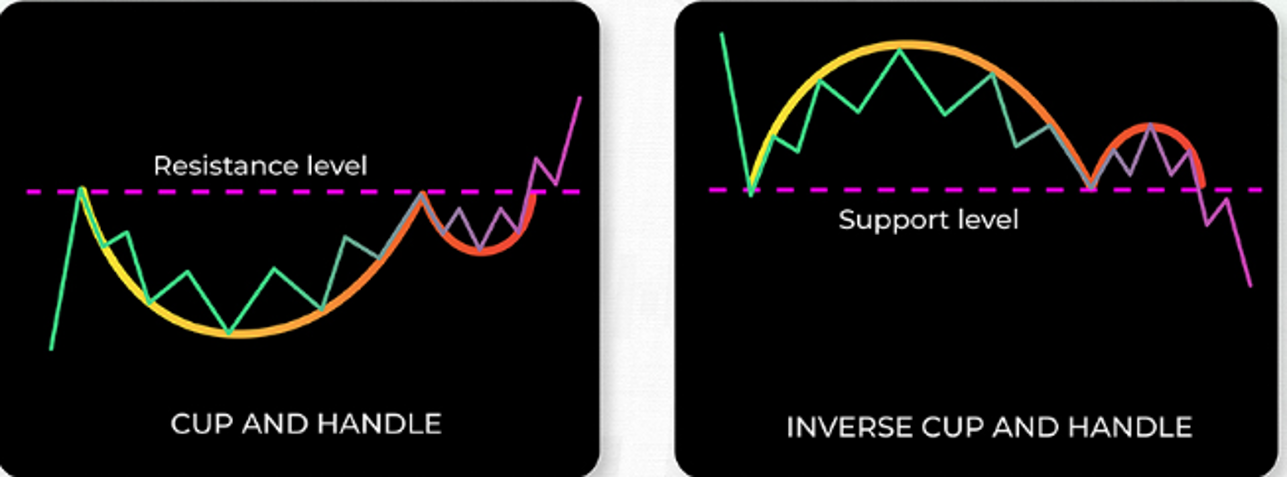
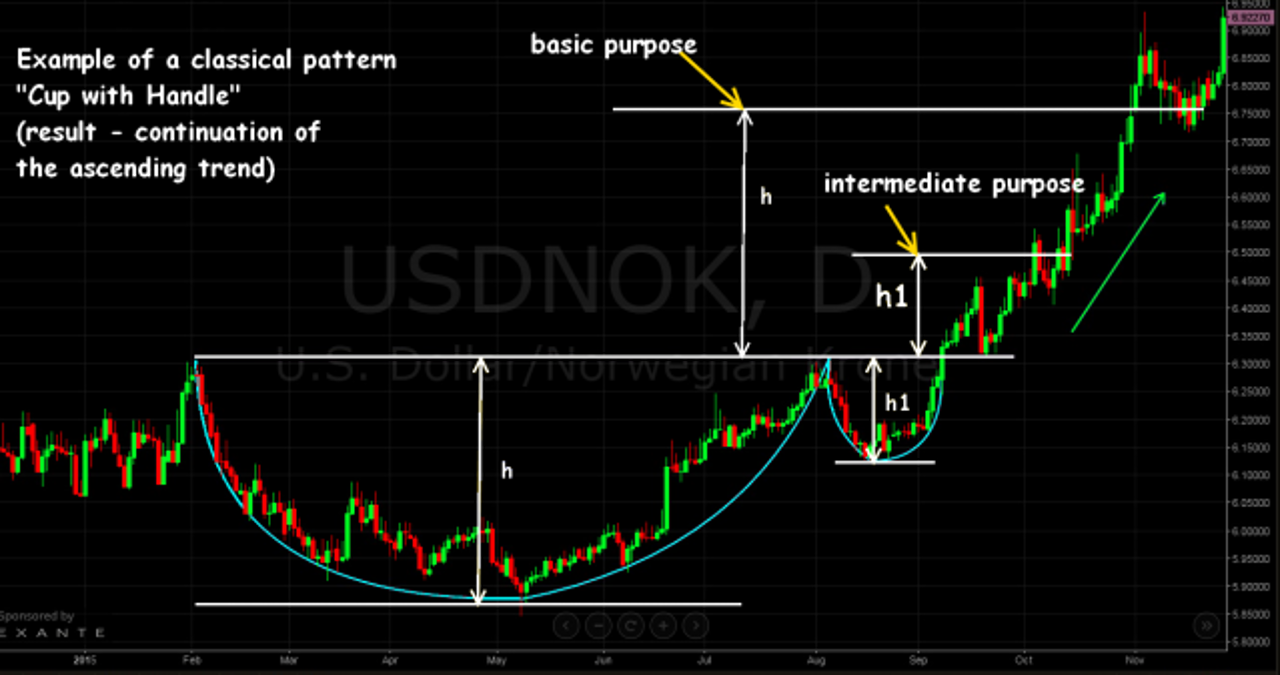
- Cup: The “cup” looks like a rounded bottom, like a Round Bottom pattern. It represents a consolidation phase, where the price initially declines and then rises back to the previous high, forming a U-shape.
- Handle: After the price reaches the previous high, it pulls back slightly, forming a small downward sloping “handle.” This handle represents a brief period of consolidation before the price breaks out to the upside.
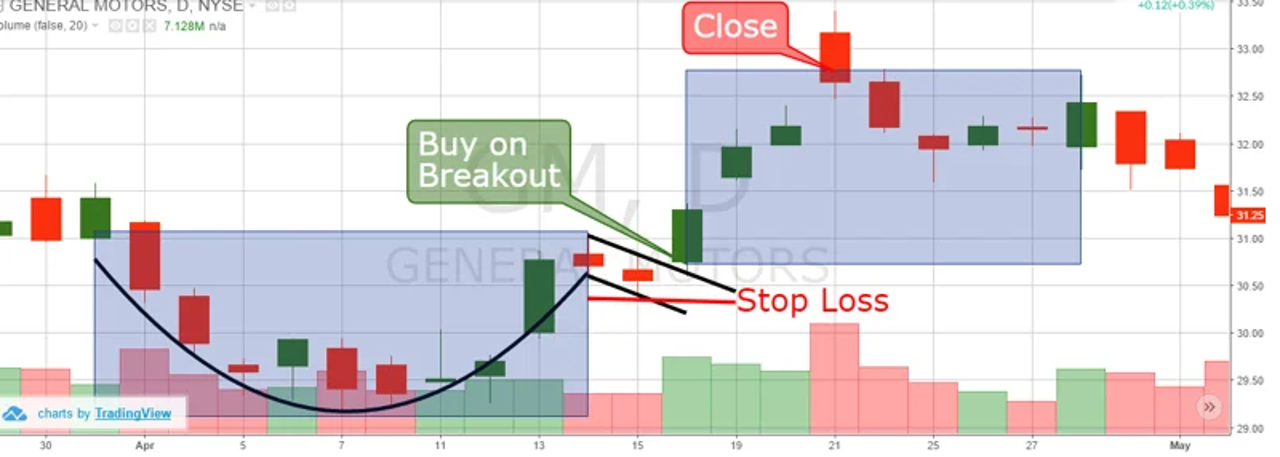
- Buying Signal: A buy signal is triggered when the price breaks above the upper trendline of the handle. This breakout confirms that the consolidation phase is over, and the uptrend is likely to resume. Traders typically enter a long position when the price closes above the handle’s resistance level.
- Selling Signal: The Cup and Handle pattern is primarily a bullish continuation pattern, so there isn’t a conventional selling signal. However, if the price breaks below the lower trendline of the handle instead of breaking out to the upside, traders may consider selling or avoiding the trade due to the risk of a failed breakout.
- Stop-Loss Consideration: Traders who buy after a Cup and Handle breakout should place a stop-loss order just below the low point of the handle to protect against false breakouts or trend reversals.
Inverted Cup and Handle:
- Formation: The Inverted Cup and Handle pattern is the bearish counterpart to the Cup and Handle. It forms during a downtrend and consists of two parts:
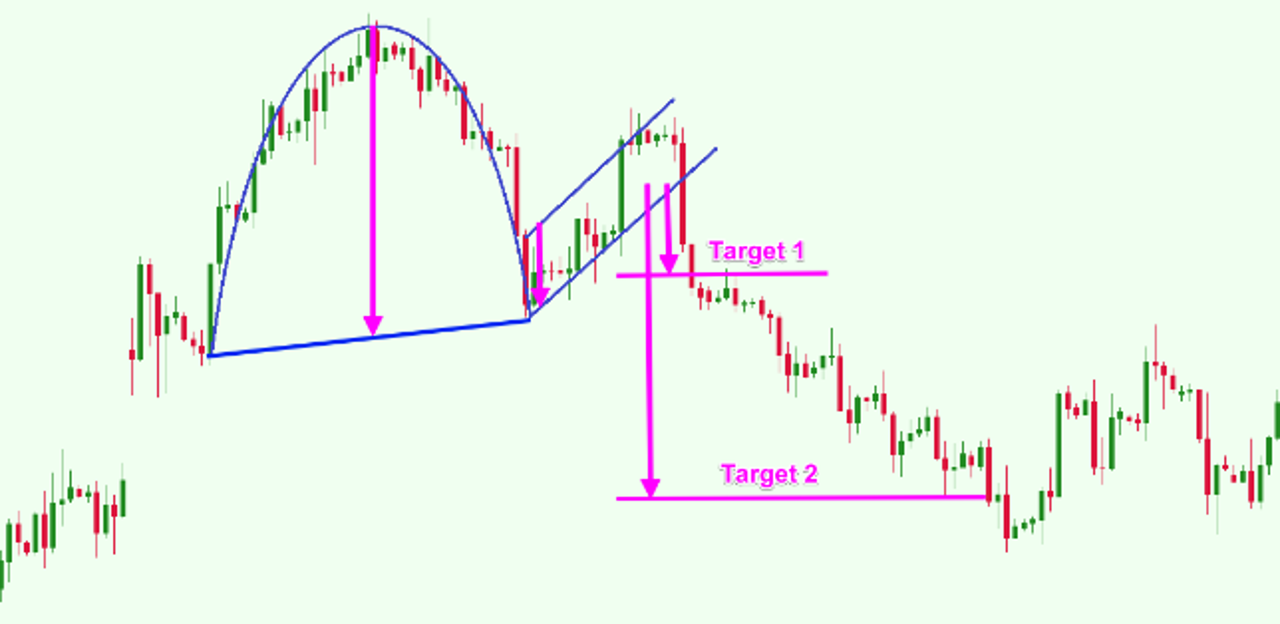
- Cup: The “cup” looks like a rounded top, like a Round Top pattern. It represents a consolidation phase, where the price initially rises and then declines back to the previous low, forming an inverted U-shape.
- Handle: After the price reaches the previous low, it rallies slightly, forming a small upward-sloping “handle.” This handle represents a brief period of consolidation before the price breaks down.
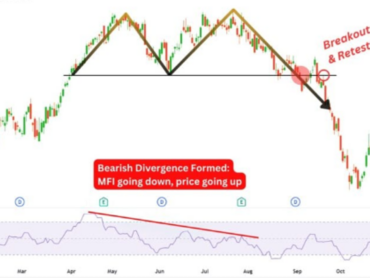
- Selling Signal: A sell signal is triggered when the price breaks below the lower trendline of the handle. This breakdown confirms that the consolidation phase is over, and the downtrend is likely to resume. Traders typically enter a short position when the price closes below the handle’s support level.
- Buying Signal: The Inverted Cup and Handle pattern is primarily a bearish reversal pattern, so there isn’t a conventional buying signal. However, if the price breaks above the upper trendline of the handle instead of breaking down, traders may consider buying, but this is considered risky and a countertrend trade.
- Stop-Loss Consideration: Traders who short-sell after an Inverted Cup and Handle breakdown should place a stop-loss order just above the high point of the handle to protect against false breakdowns or trend reversals.
Measuring Price Targets:
- For both patterns, the potential price target after a breakout (or breakdown) can be estimated by measuring the height of the cup (the distance between the high and low points of the cup) and projecting that distance from the breakout (or breakdown) point. This gives traders a rough idea of how far the price could move after the pattern is completed.
The Psychology Behind Cup and Handle and Inverted Cup and Handle Patterns
The psychology behind the Cup and Handle and Inverted Cup and Handle patterns reflects a consolidation phase within a trend, followed by a continuation or reversal in the trend direction. These patterns occur after a significant price movement and represent a “pause” in the market before the next big move.
Cup and Handle Psychology:
- Cup Formation (Accumulation Phase): During the formation of the cup, the price declines as sellers take profits or weak hands exit the market. However, the selling pressure is not strong enough to reverse the uptrend, and buyers gradually step in at lower levels, causing the price to stabilize and eventually rise again. This forms the rounded bottom of the cup, signalling that buyers are gradually regaining control.
- Handle Formation (Final Consolidation): After the price reaches the previous high, it pulls back slightly, forming the handle. This pullback represents a final consolidation phase as traders wait for confirmation of the breakout. Once the price breaks above the resistance level, it signals that the bulls have fully regained control, and the uptrend is likely to continue.
Inverted Cup and Handle Psychology:
- Cup Formation (Distribution Phase): During the formation of the inverted cup, the price rises as buyers push the market higher, but the buying pressure starts to weaken. Eventually, sellers begin to take control, causing the price to decline back to the previous low. This forms the rounded top of the cup, signaling that the market is transitioning from a bullish phase to a bearish phase.
- Handle Formation (Final Consolidation): After the price reaches the previous low, it rallies slightly, forming the handle. This rally represents a final consolidation phase as traders wait for confirmation of the breakdown. Once the price breaks below the support level, it signals that the bears have fully regained control, and the downtrend is likely to continue.
In both patterns, the handle represents a critical consolidation phase where buyers and sellers are in a temporary standoff. The breakout (or breakdown) signals the resolution of this standoff and the continuation of the prevailing trend.
How to Use Cup and Handle and Inverted Cup and Handle Patterns to Invest in the Stock Market
The Cup and Handle and Inverted Cup and Handle patterns are valuable tools for both short-term and long-term traders, providing clear entry and exit points. Here’s how traders can use these patterns in the stock market:
- Trend Continuation and Reversal Trading:
- Cup and Handle (Bullish Continuation): The Cup and Handle pattern is a continuation pattern, so traders can use it to identify opportunities to enter an existing uptrend. After the price completes the handle and breaks above the resistance level, traders can enter a long position, expecting the uptrend to continue.
- Inverted Cup and Handle (Bearish Reversal): The Inverted Cup and Handle pattern is a reversal pattern, signalling that an uptrend is about to reverse into a downtrend. Traders can use this pattern to identify short-selling opportunities. After the price breaks below the handle’s support level, traders can enter a short position, expecting the downtrend to continue.
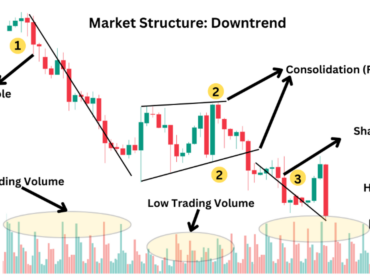
- Volume Confirmation:
- Volume is a critical factor in confirming the breakout or breakdown of both patterns. Traders should look for a significant increase in volume when the price breaks above the handle’s resistance level (Cup and Handle) or breaks below the support level (Inverted Cup and Handle). This confirms that the breakout or breakdown is supported by strong market participation.
- Stop-Loss Orders:
- Using stop-loss orders is essential for managing risk when trading these patterns. Traders should place stop-loss orders just below the low point of the handle (Cup and Handle) or just above the high point of the handle (Inverted Cup and Handle) to protect against false breakouts or breakdowns.
- Target Projection:
- Traders can estimate a price target by measuring the height of the cup and projecting that distance from the breakout (Cup and Handle) or breakdown (Inverted Cup and Handle) point. This helps traders set realistic profit-taking targets and manage their trades effectively.
- Swing Trading:
- The Cup and Handle and Inverted Cup and Handle patterns are ideal for swing traders, as they signal significant continuation or reversal opportunities. Swing traders can enter positions at the breakout or breakdown point and ride the trend for a short to medium period before taking profits.
- Traders may also use trailing stop orders to lock in profits as the price moves in their Favor.
- Combining with Other Indicators:
- The Cup and Handle and Inverted Cup and Handle patterns are most effective when used in conjunction with other technical analysis tools. For example, traders can use the RSI (Relative Strength Index) to confirm whether the market is overbought or oversold before entering a trade.
- Moving averages, such as the 50-day or 200-day moving average, can also be used to confirm the trend direction and the strength of the breakout or breakdown. Additionally, the MACD (Moving Average Convergence Divergence) indicator can help assess the momentum behind the breakout.
- Day Trading:
- Although these patterns typically develop over longer periods, they can also be used for day trading on shorter timeframes. Day traders can capitalize on the quick price movements that often follow a breakout or breakdown, but they must manage risk tightly by using stop-loss orders and setting realistic price targets.
Conclusion:
The Cup and Handle and Inverted Cup and Handle patterns are reliable technical analysis tools that provide traders with clear signals for entering or exiting trades. Whether you’re trading stocks, forex, or other assets, understanding how to identify these patterns and trade breakouts or breakdowns can significantly enhance your success in the market. By using volume confirmation, setting appropriate stop-loss orders, and combining these patterns with other technical indicators, traders can capitalize on trend continuations and reversals with confidence.