Triangle chart patterns are a common and powerful tool in technical analysis. They fall under the category of continuation patterns, which suggest that the price trend will likely continue in the same direction after a brief period of consolidation. There are three main types of triangle patterns: Symmetrical Triangle, Ascending Triangle, and Descending Triangle.
How Triangle Chart Patterns Work for Buying and Selling
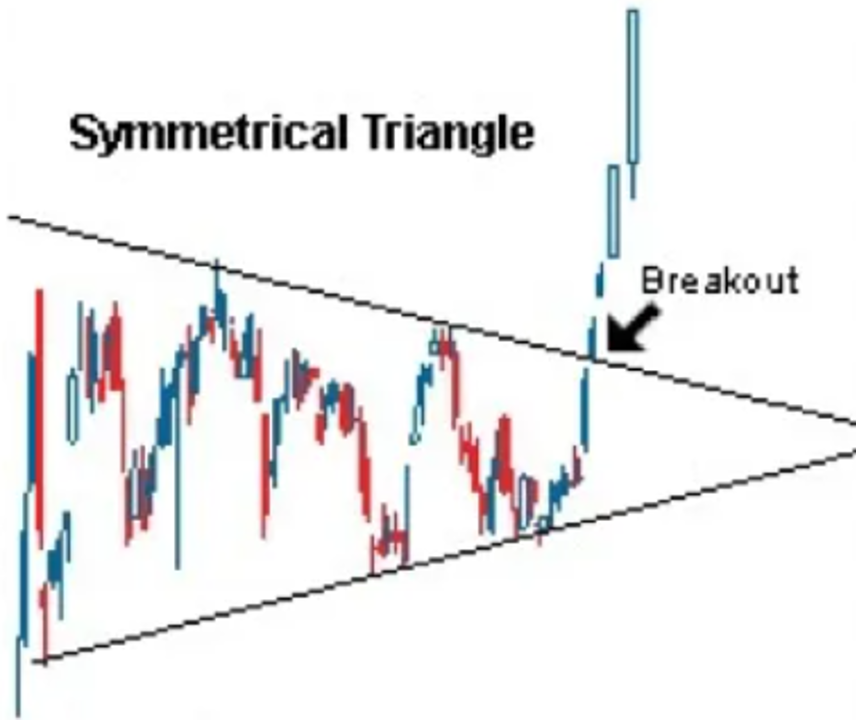
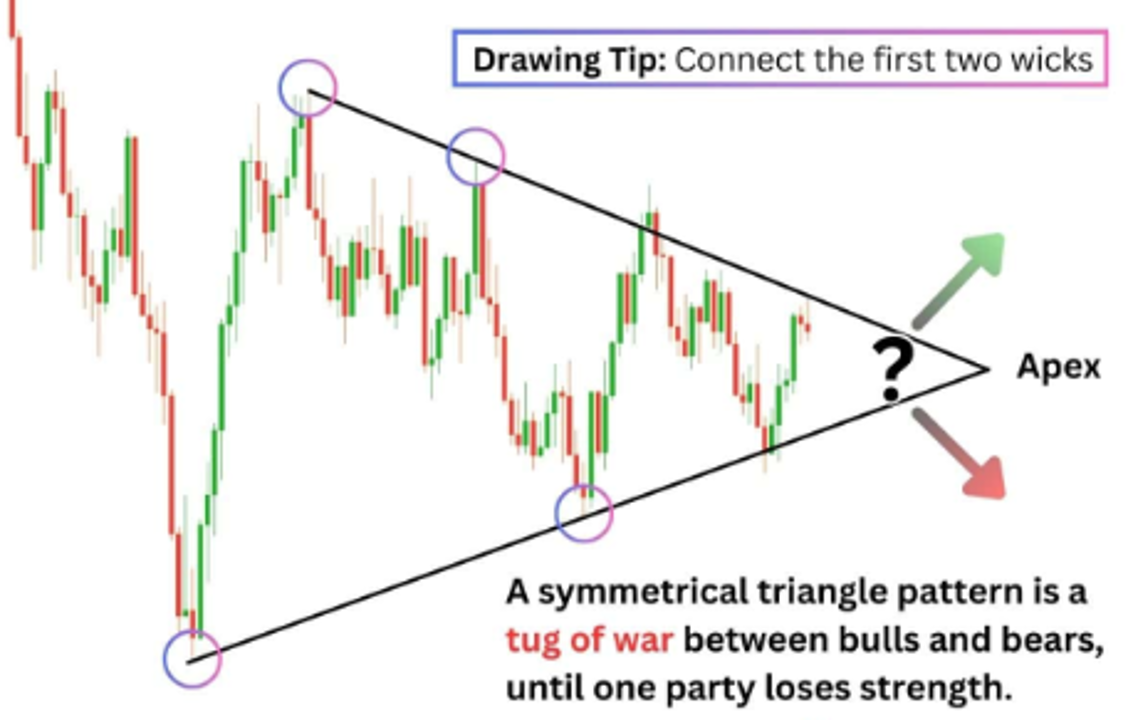
Symmetrical Triangle:
- Formation: A symmetrical triangle is formed when there is a series of lower highs and higher lows. The price action gets squeezed between converging trendlines, forming a triangle shape. The range of price movement decreases as the triangle progresses toward the apex, where a breakout typically occurs.
- Buying Signal: In a symmetrical triangle, a trader would buy when the price breaks above the upper trendline. The upward breakout indicates that the market is resuming its previous uptrend.
- Selling Signal: On the other hand, a sell signal occurs when the price breaks below the lower trendline, indicating the continuation of a downtrend.
- Stop-Loss Consideration: After a breakout, a stop-loss can be placed just below the breakout point (for a buy) or above it (for a sell), ensuring that you limit your losses if the breakout turns out to be false.
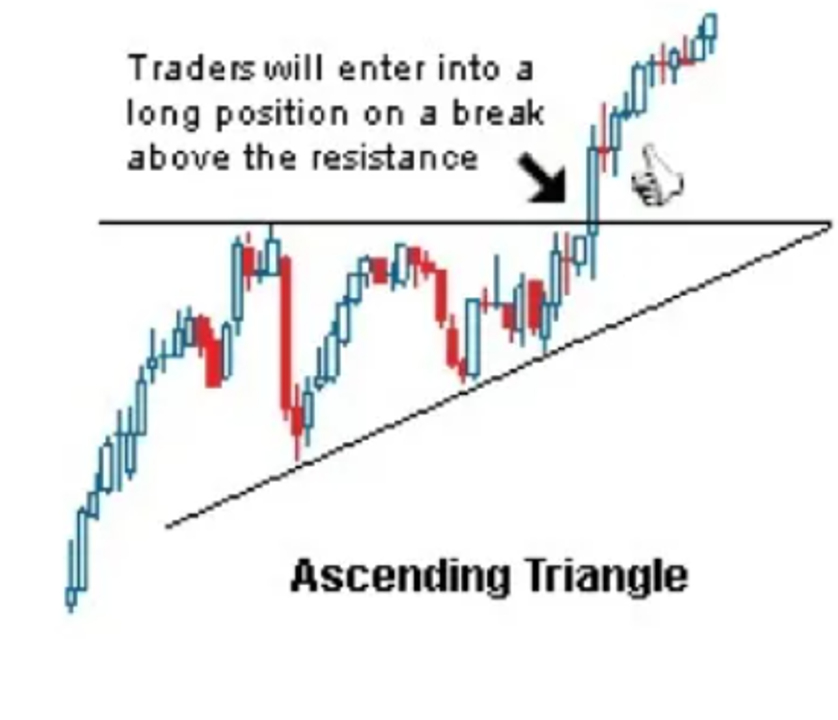
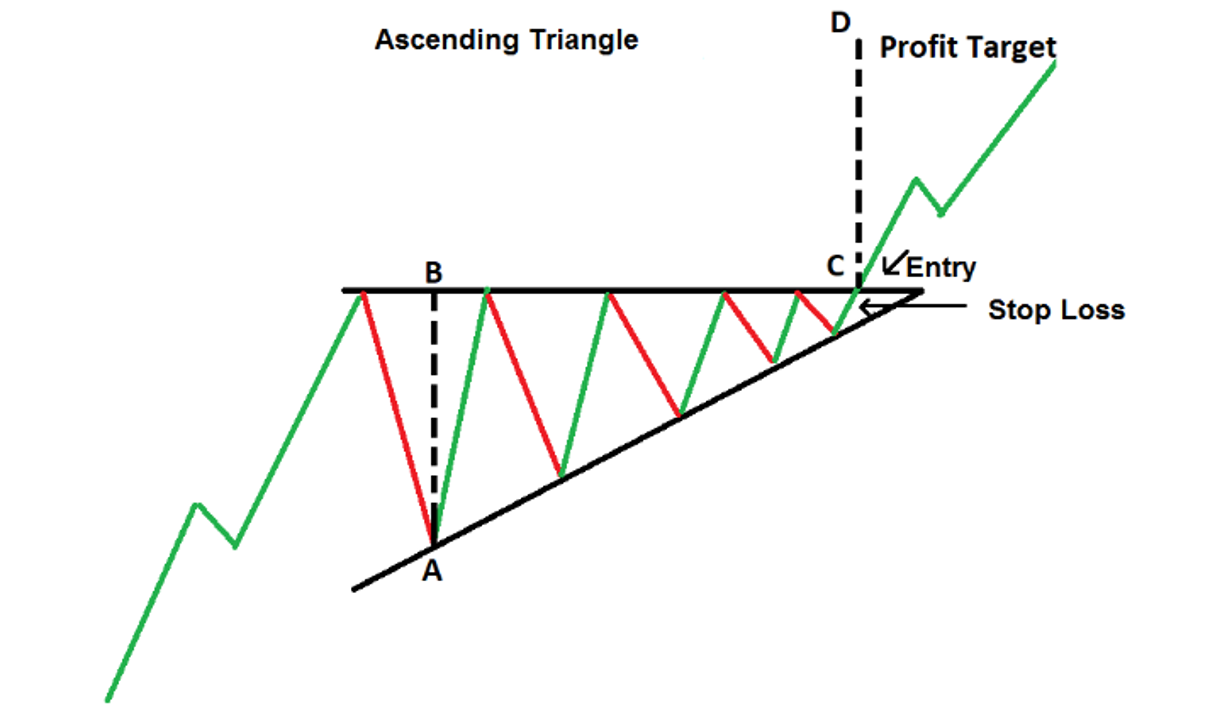
Ascending Triangle:
- Formation: An ascending triangle occurs when the price experiences resistance at a horizontal level but continues to form higher lows. The trendline connecting these higher lows converges with the resistance level, creating an ascending triangle shape.
- Buying Signal: A breakout above the horizontal resistance line is a buying signal. This indicates that the upward momentum has overtaken the resistance level, suggesting that the uptrend will continue.
- Selling Signal: In some rare cases, the price may break below the ascending support line, which could be taken as a signal to sell. However, ascending triangles are predominantly bullish patterns, so breakdowns are less frequent.
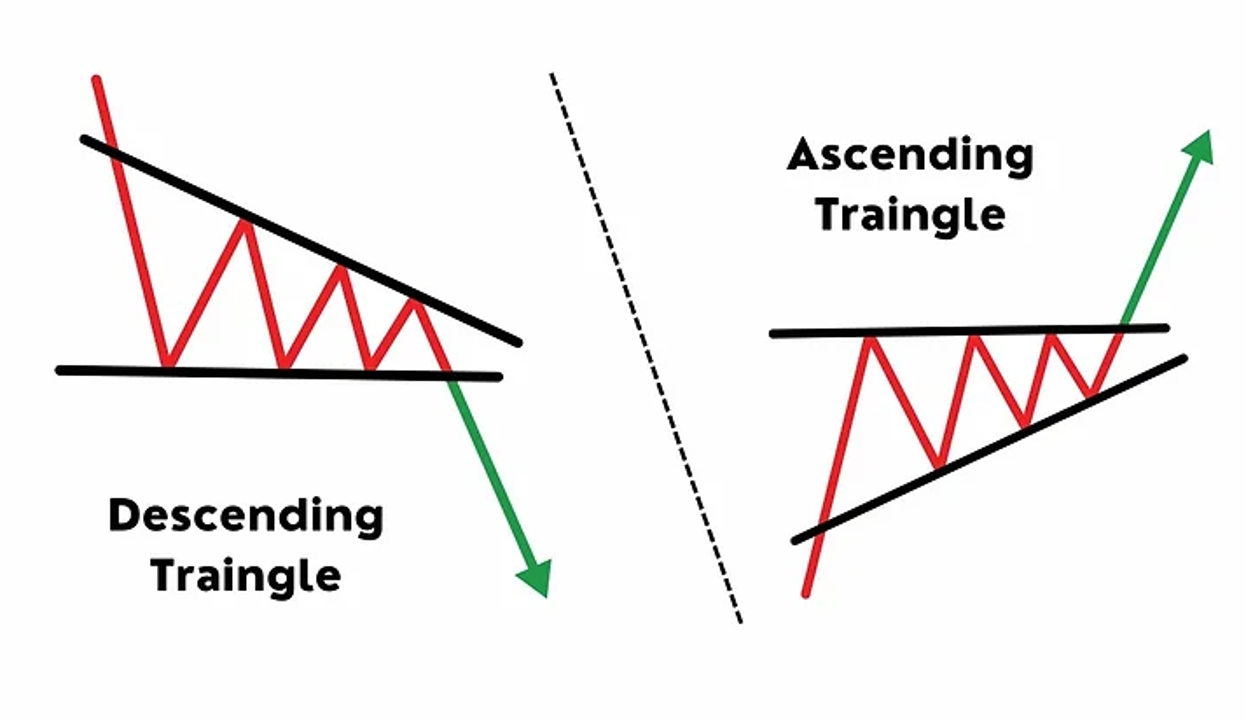
Descending Triangle:
- Formation: The descending triangle is the opposite of the ascending triangle, with a horizontal support level and a descending resistance line connecting lower highs.
- Selling Signal: A breakdown below the horizontal support level is a signal to sell, as the bears are taking control, and the price is expected to continue downward.
- Buying Signal: While the descending triangle is usually a bearish pattern, a breakout above the resistance line could indicate the start of a new uptrend. This is a less common scenario but should not be ignored by traders.
The Psychology Behind Triangle Chart Patterns
The psychology behind triangle chart patterns reflects a battle between buyers and sellers. During the formation of a triangle, both parties are undecided, resulting in a decrease in volatility as the price becomes compressed within the converging trendlines.
- Symmetrical Triangle: This pattern reflects market indecision and a balance between supply and demand. Both bulls and bears are hesitant, but one side eventually wins when the price breaks out of the triangle. A breakout in either direction signifies a resolution of this indecision, and the winning side (buyers or sellers) is likely to dominate for a while.
- Ascending Triangle: In an ascending triangle, buyers are more aggressive, evidenced by the higher lows. However, they face resistance at a key level, where sellers are initially able to hold the price down. As the buyers continue to push higher, the sellers weaken, and eventually, a breakout occurs, favouring the buyers. The pattern signals strength and bullish sentiment.
- Descending Triangle: The opposite psychology applies to the descending triangle. Sellers are more aggressive, creating lower highs, while buyers are holding the price at a key support level. However, as the sellers keep pressuring the price down, the buyers eventually weaken, leading to a bearish breakdown. This pattern reflects market pessimism and bearish sentiment.
In all cases, the breakout direction reflects the resolution of the psychological tension between buyers and sellers.
How to Use Triangle Patterns in Stock Market Investing
Triangle patterns are highly versatile and can be applied across different markets (stocks, forex, cryptocurrencies) and timeframes. Here are some practical ways readers can use these patterns:
- Trend Continuation Trading:
- Triangle patterns are often used to join existing trends. In a bull market, spotting an ascending or symmetrical triangle can give traders the confidence to enter a trade just before the continuation of the uptrend.
- Similarly, in a bear market, descending triangles are reliable signals for joining the downward trend.
- Breakout Trading:
- Triangle patterns provide clear entry points. Traders wait for a breakout beyond the triangle’s trendlines and enter their trades based on the direction of the breakout.
- When entering trades on breakouts, it’s crucial to use stop-loss orders. A stop-loss can be placed just outside the opposite trendline of the breakout to limit potential losses.
- Volume Confirmation:
- A breakout from a triangle is more reliable if it is accompanied by a significant increase in volume. Investors should always confirm breakouts with rising volume to avoid false breakouts.
- False breakouts can occur in low-volume environments, where the price breaks the trendline but quickly reverses, trapping traders.
- Swing Trading Strategy:
- Triangle patterns are particularly useful for swing traders. These patterns provide excellent opportunities for catching momentum-driven swings as the price consolidates within the triangle and then breaks out.
- A common approach is to calculate a price target by measuring the height of the triangle and projecting it from the breakout point. This gives traders a realistic target for taking profits.
- Combination with Other Indicators:
- While triangle patterns provide clear entry and exit signals, they work best when combined with other technical indicators like the Relative Strength Index (RSI), Moving Averages, or the Moving Average Convergence Divergence (MACD).
- These indicators can confirm the strength of the trend and signal whether a breakout is likely to have momentum behind it
-
“Capitalizing on Consolidation Patterns in a Strong Uptrend: A Strategy for Traders”
In a strong uptrend, it’s common for various chart patterns such as triangles, wedges, and pennants to form during periods of sideways consolidation. These patterns often indicate a temporary pause in price movement, as the market takes a breather before potentially continuing its upward trend. Traders should closely monitor these short-term consolidation phases, as they often present opportunities to enter the market at favorable points.
One effective strategy is to place a stop-buy limit order just above the upper boundary of the consolidation pattern. This allows traders to automatically enter a long position if the price breaks out of the consolidation, confirming the resumption of the upward trend. By doing so, traders can capture potential gains from the breakout while managing their risk by setting appropriate stop-loss orders. Recognizing and acting on these consolidation patterns can enhance a trader’s ability to profit in a trending market.
Conclusion:
Triangle chart patterns are essential tools in technical analysis, offering traders a reliable way to enter and exit trades during periods of consolidation. Whether you’re trading stocks, forex, or cryptocurrencies, understanding the psychology, breakout signals, and probabilities behind these patterns can significantly improve your success rate. By mastering symmetrical, ascending, and descending triangles, traders can confidently apply these patterns in various market conditions to enhance their trading strategy.
