The Wedge pattern is a popular chart pattern used in technical analysis that signals a reversal or continuation of a price trend, depending on the type of wedge and the breakout direction. Wedge patterns are identified by converging trendlines and a tapering price range. They indicate that price action is compressing, and a significant move is likely once the price breaks out of the wedge. There are two main types of wedge patterns:
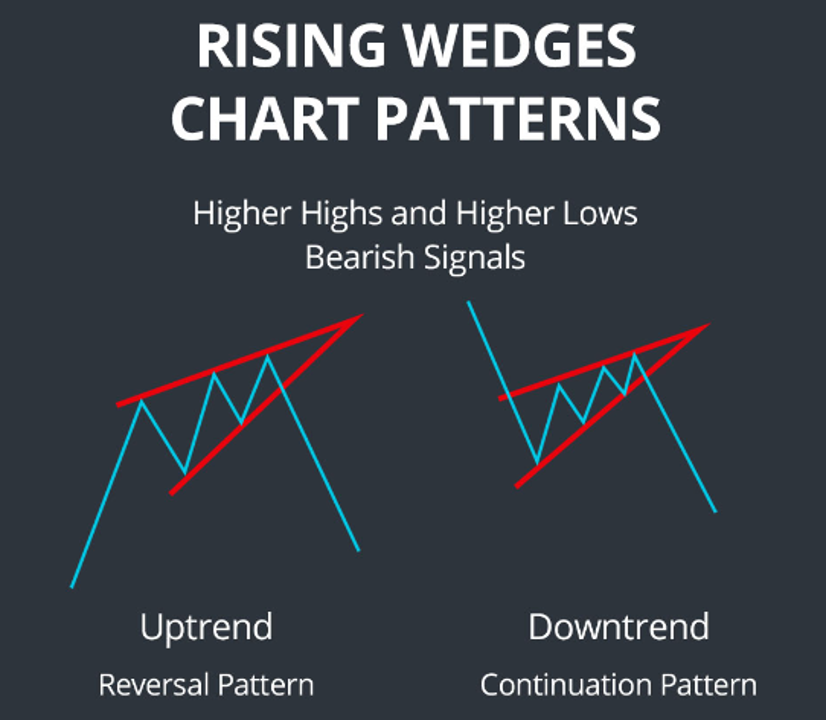
- Rising Wedge: Generally, a bearish pattern, signalling a potential downward reversal.
- Falling Wedge: Generally, a bullish pattern, signalling a potential upward reversal.
How the Wedge Chart Pattern Works for Buying and Selling
Rising Wedge:
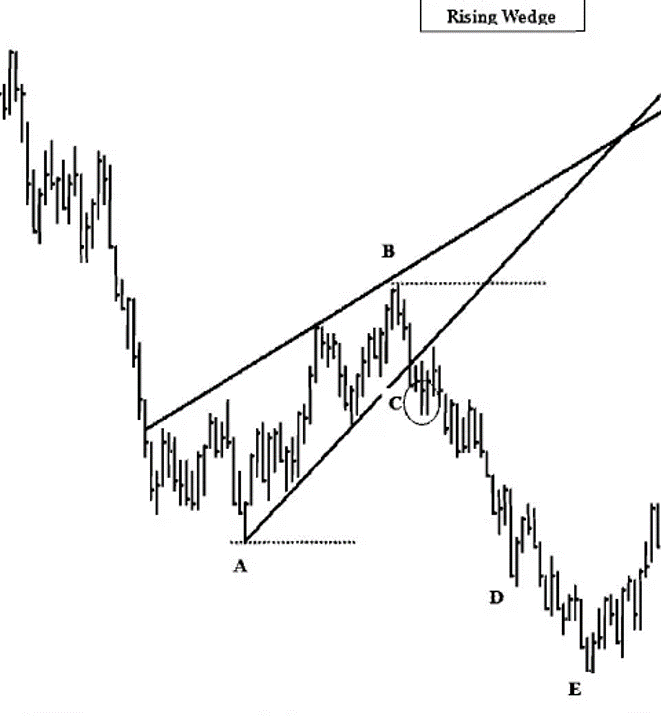
- Formation: The Rising Wedge pattern forms when the price moves between two upward-sloping, converging trendlines. The upper trendline acts as resistance, while the lower trendline acts as support. Even though the price is rising, the narrowing price range indicates that buying pressure is weakening.
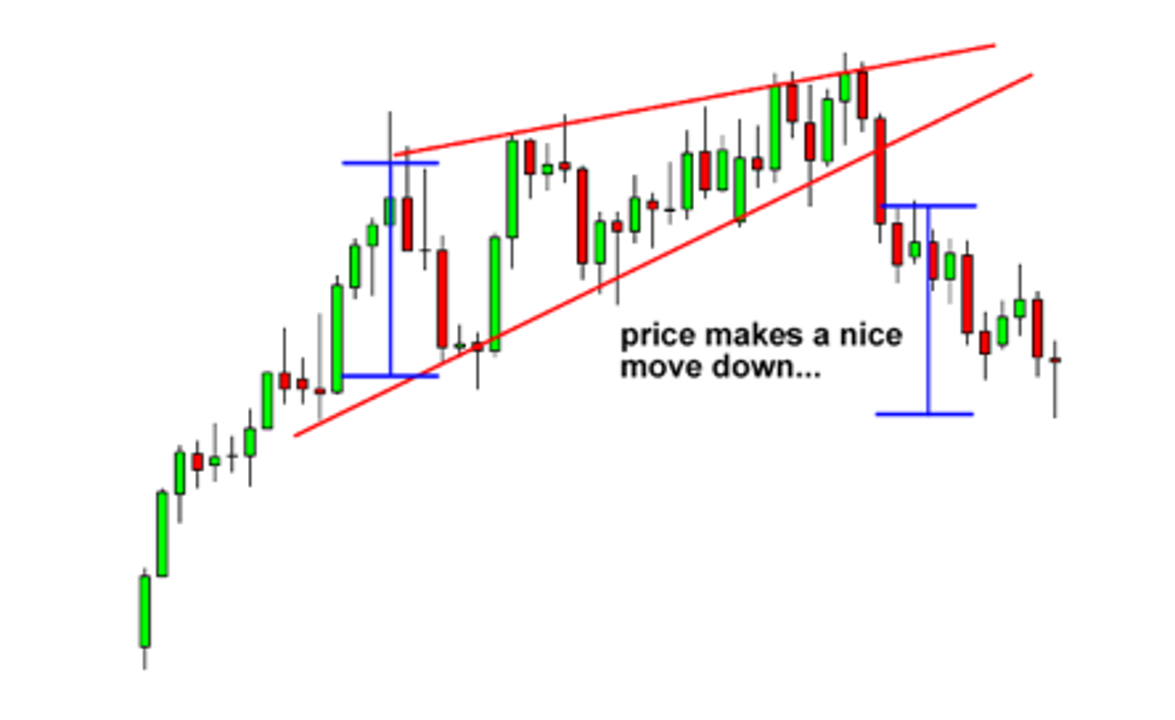
- Selling Signal: A trader would typically sell when the price breaks below the lower support trendline. The breakout to the downside confirms that the upward trend is losing momentum and that the bears are taking control. This signals a potential reversal from an uptrend to a downtrend.
- Buying Signal: While the Rising Wedge is primarily a bearish pattern, in some rare cases, the price may break above the upper resistance trendline, signaling a continuation of the uptrend. However, this is considered less common and can be risky for buyers.
- Stop-Loss Consideration: A stop-loss order can be placed just above the upper resistance trendline to limit potential losses in case the breakout to the downside fails or if the price unexpectedly rises.
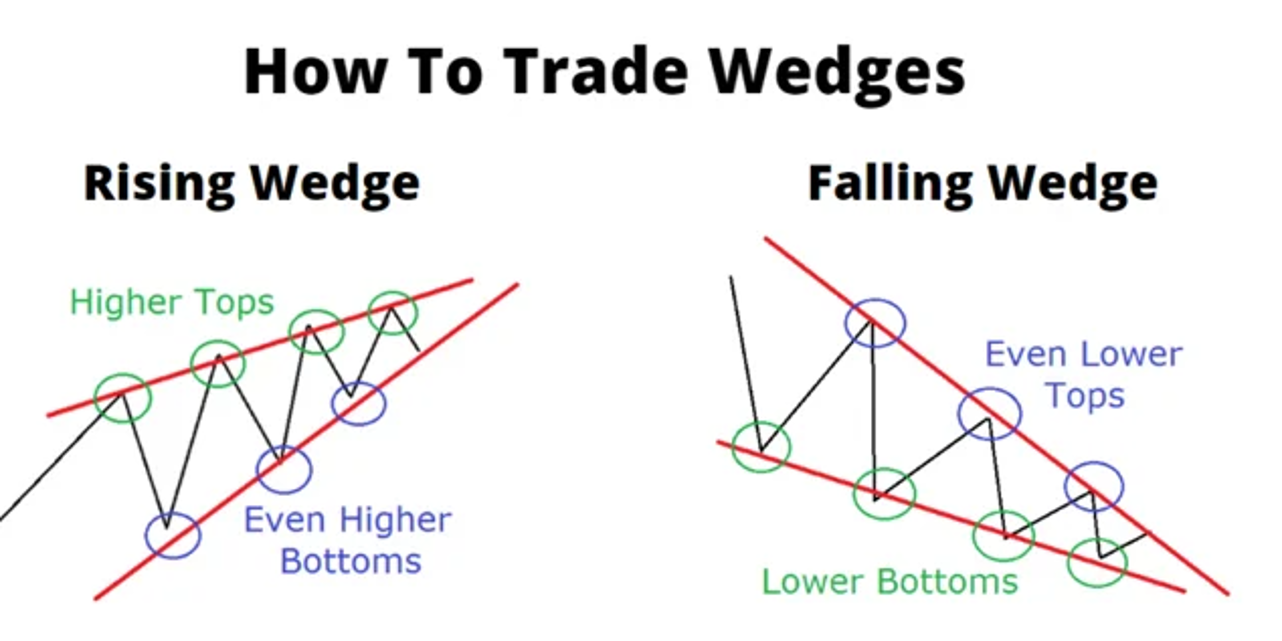
Falling Wedge:
- Formation: The Falling Wedge pattern forms when the price moves between two downward-sloping, converging trendlines. The lower trendline acts as support, while the upper trendline acts as resistance. Even though the price is falling, the narrowing price range indicates that selling pressure is weakening.
- Buying Signal: A trader would typically buy when the price breaks above the upper resistance trendline. The breakout to the upside confirms that the downward trend is losing momentum and that the bulls are taking control. This signals a potential reversal from a downtrend to an uptrend.
- Selling Signal: While the Falling Wedge is primarily a bullish pattern, in rare cases, the price may break below the lower support trendline, signalling a continuation of the downtrend. However, this is less common and can be risky for sellers.
- Stop-Loss Consideration: A stop-loss order can be placed just below the lower support trendline to limit potential losses in case the breakout to the upside fails or if the price unexpectedly drops.
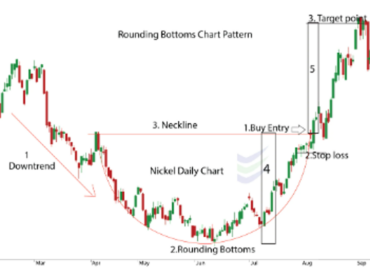
Measuring Price Targets:
- The potential price target after a breakout from either wedge pattern can be estimated by measuring the distance between the highest and lowest points of the wedge at the start of the pattern and projecting that distance from the breakout point. This gives traders a rough idea of how far the price could move after the breakout
The Psychology Behind Wedge Chart Patterns
The psychology behind wedge patterns reflects the gradual weakening of a trend (either up or down) as the price compresses within converging trendlines. Traders can interpret this narrowing price action as a sign that a breakout is imminent.
Rising Wedge Psychology:
- Gradual Weakening of Buying Pressure: In a rising wedge, the price continues to make higher highs and higher lows, but the range of price movement is narrowing. This narrowing range reflects a weakening in buying momentum. Even though the price is moving upward, buyers are finding it increasingly difficult to push the price higher, as sellers begin to step in and counteract the buying pressure.
- Breakout (Bearish): When the price breaks below the lower trendline, it signals that sellers have gained control, and the uptrend is over. The breakout confirms that the bullish momentum has faded, and a downtrend is likely to begin.
Falling Wedge Psychology:
- Gradual Weakening of Selling Pressure: In a falling wedge, the price continues to make lower highs and lower lows, but the range of price movement is narrowing. This narrowing range reflects a weakening in selling momentum. Even though the price is falling, sellers are finding it increasingly difficult to push the price lower, as buyers begin to step in and support the price.
- Breakout (Bullish): When the price breaks above the upper trendline, it signals that buyers have gained control, and the downtrend is over. The breakout confirms that the bearish momentum has faded, and an uptrend is likely to begin.
In both wedge patterns, the breakout (either bullish or bearish) represents the resolution of the market tension that has built up as the price range narrows. The breakout typically occurs in the direction opposite to the wedge’s slope, meaning Rising Wedges tend to break downward and Falling Wedges tend to break upward.
How to Use Wedge Patterns to Invest in the Stock Market
Wedge patterns are highly versatile and can be used across different markets and timeframes, including stocks, forex, and cryptocurrencies. Here’s how traders can use wedge patterns to enhance their stock market strategies:
Trend Reversal Trading:
- Wedge patterns are primarily reversal patterns, and traders can use them to identify key turning points in a trend. For instance, a Rising Wedge forming during an uptrend can signal the end of the uptrend and the start of a new downtrend, making it a prime opportunity for traders to sell or short-sell.
- Conversely, a Falling Wedge forming during a downtrend can signal the end of the downtrend and the start of a new uptrend, providing an opportunity for traders to buy.
- However, they can also function as continuation patterns, depending on the context in which they appear and the breakout direction. This means that instead of reversing the current trend, the wedge may result in the continuation of the prevailing trend after a brief period of consolidation.
Key Characteristics of a Continuation Wedge:
- Convergence of Trendlines: The wedge pattern shows narrowing price movement as the highs and lows converge toward each other.
- Volume Decline: Volume often decreases during the formation of the wedge, signaling indecision and consolidation in the market.
- Breakout in the Direction of the Prevailing Trend: The key factor that distinguishes a continuation wedge from a reversal wedge is the direction of the breakout. In a continuation wedge, the breakout occurs in the direction of the current trend (upward in a Rising Wedge, downward in a Falling Wedge).
Volume Confirmation:
- Traders should always look for a significant increase in trading volume when the price breaks out of a wedge pattern. Volume confirmation is critical because it shows that the breakout is supported by strong market participation.
- For example, a breakout from a Rising Wedge that is accompanied by rising volume is a strong signal that the breakout is likely to continue in the downward direction. Conversely, a breakout from a Falling Wedge with rising volume is a strong signal that the price is likely to continue upward.
Stop-Loss Orders:
- Using stop-loss orders is essential for managing risk when trading wedge patterns. Traders should place their stop-loss orders just outside the opposite trendline of the breakout to minimize potential losses.
- For example, in a Rising Wedge, the stop-loss can be placed just above the upper resistance trendline to limit losses in case the breakout to the downside fails. In a Falling Wedge, the stop-loss can be placed just below the lower support trendline to protect against false breakouts.
Target Projection:
- Traders can estimate a price target after the breakout by measuring the distance between the highest and lowest points of the wedge and projecting that distance from the breakout point. This helps traders set realistic profit targets and manage their trades effectively.
Swing Trading:
- Wedge patterns are ideal for swing traders because they often signal significant reversals or continuations in price trends. Swing traders can use wedge breakouts to capture short- to medium-term price movements in the direction of the breakout.
- A common strategy for swing traders is to enter a trade at the breakout point and use a trailing stop order to lock in profits as the price moves in their favor.
Combining Wedge Patterns with Other Indicators:
- Wedge patterns work best when used in conjunction with other technical indicators. For instance, traders can combine wedge patterns with momentum indicators such as the RSI (Relative Strength Index) to determine whether the market is overbought or oversold before entering a trade.
- Moving averages can also help confirm the strength of the trend and the likelihood that the breakout will follow through. Additionally, the MACD (Moving Average Convergence Divergence) indicator can be used to assess the strength of the momentum behind the breakout.
Day Trading:
- Wedge patterns can also be used for day trading, especially on shorter timeframes. Day traders can capitalize on the quick price movements that often follow a wedge breakout. However, day traders should be prepared for volatility and manage their risk tightly by using stop-loss orders and setting realistic price targets.
Conclusion:
The Rising Wedge and Falling Wedge patterns are reliable reversal patterns that can provide traders with clear signals to enter or exit trades. Whether you’re trading stocks, forex, or cryptocurrencies, understanding how to identify wedge patterns and trade breakouts. Thank you