Trendlines in Technical Analysis
Trendlines are one of the most fundamental tools used in technical analysis. They help traders identify and confirm trends, assess potential support and resistance levels, and determine the overall direction of a market. Trendlines are drawn by connecting a series of highs or lows on a price chart and serve as visual guides for predicting future price movements.
This write-up will cover how to use trendlines for both buying and selling, discuss various trendline variations, explain the psychology behind trendlines, and explore their advantages and disadvantages. Additionally, we’ll look at how to combine trendlines with technical indicators like volume, MACD, and RSI, and present an effective trendline trading strategy.
________________________________________
How Trendlines Work for Buying and Selling
________________________________________
Uptrend (Support) Line for Buying:
• Formation: An uptrend line is drawn by connecting a series of higher lows in a rising market. This line acts as a support level that helps traders identify when to buy during a bullish market.
• Buying Signal: Traders often buy when the price pulls back to the uptrend line and bounces, indicating that the support is holding, and the uptrend is likely to continue. This is known as buying on a dip.
•Downtrend (Resistance) Line for Selling:
• Formation: A downtrend line is drawn by connecting a series of lower highs in a falling market. This line acts as a resistance level, showing where traders might look to sell during a bearish trend.
• Selling Signal: Traders may sell or short-sell when the price rallies up to the downtrend line and gets rejected, indicating that the resistance is holding and the downtrend is likely to continue. This is known as selling on a rally.
________________________________________
Different Trendline Variations
________________________________________
There are different variations of trendlines based on market conditions, including:
Standard Trendlines (Uptrend & Downtrend):
• Uptrend Line: Drawn by connecting consecutive higher lows. It represents support and is used to confirm bullish momentum.
• Downtrend Line: Drawn by connecting consecutive lower highs. It represents resistance and confirms bearish momentum.
Internal Trendlines:
• Internal Trendlines are drawn through the price action instead of connecting exact highs or lows. These lines capture the general direction of the market and account for minor price fluctuations.
Accelerating Trendlines:
• As the price increases or decreases more rapidly, a steeper trendline may be drawn to capture the sharper movement. These trendlines indicate stronger momentum but can break more easily when the trend loses strength.
________________________________________
The Psychology Behind Trendlines
________________________________________
Trendlines reflect market psychology and the ongoing battle between buyers and sellers.
• Uptrend Line Psychology: In an uptrend, buyers consistently enter the market when the price retraces to the trendline. This dynamic creates higher lows, with traders viewing the trendline as a support level where demand exceeds supply. The trendline visually represents buying confidence.
• Downtrend Line Psychology: In a downtrend, sellers consistently sell when the price rallies to the downtrend line, creating lower highs. The trendline becomes a resistance level where supply exceeds demand, showing selling confidence. Traders use the trendline as a reference point for short-selling opportunities.
• Breakouts and Breakdowns: When the price breaks through a trendline (either up or down), it signifies a potential shift in sentiment. For example, breaking below an uptrend line may indicate that buying pressure is weakening, leading to a potential trend reversal. Similarly, breaking above a downtrend line shows that sellers are losing control, and a bullish reversal may be on the horizon.
________________________________________
Advantages and Disadvantages of Using Trendlines in Charting
________________________________________
Advantages of Trendlines:
• Simple and Effective: Trendlines provide an easy-to-understand visual guide for identifying trends and potential buying or selling points.
• Works in All Timeframes: Trendlines can be applied to intraday, daily, weekly, and monthly charts, making them versatile tools.
• Confirmation Tool: Trendlines act as a form of confirmation for trends. Traders can look for multiple touches on the line to ensure its validity.
• Visualize Market Sentiment: Trendlines help traders see whether buyers or sellers are gaining control of the market, offering insight into potential trend reversals or continuations.
Disadvantages of Trendlines:
• Subjectivity: Drawing trendlines can be subjective, as different traders may draw them differently depending on which highs or lows they connect.
• False Breakouts: The price may occasionally break through a trendline only to quickly reverse, creating false breakout signals.
• Less Reliable in Sideways Markets: Trendlines are most effective in trending markets. In sideways or choppy markets, trendlines can give misleading signals and should be avoided.
________________________________________
The Best Way and the Wrong Way to Apply Trendlines
________________________________________
Best Practices for Applying Trendlines:
• Use Multiple Touchpoints: A valid trendline should connect at least two or three points (highs or lows). The more times the price respects the trendline, the more reliable it becomes.
• Consider the Timeframe: Trendlines drawn on higher timeframes (daily, weekly) are generally more reliable than those on shorter timeframes. Long-term trendlines are less prone to false breakouts.
• Use Confluence: Combine trendlines with other technical tools (support/resistance, indicators like RSI or MACD) for stronger signals.
Wrong Way to Apply Trendlines:
• Forcing a Trendline: Don’t force a trendline to fit a market condition. If the price doesn’t clearly respect the trendline, it’s best not to use it.
• Over-Dependence: Relying on trendlines alone without confirming signals (volume, momentum) can lead to inaccurate decisions.
• Drawing Steep Trendlines: Avoid drawing trendlines that are overly steep, as these tend to break easily and don’t provide reliable long-term guidance.
________________________________________
How to Use Trendlines to Invest in the Stock Market
________________________________________
Traders and investors can use trendlines in several ways to guide their decisions:
1. Buy on a Pullback to an Uptrend Line:
• In a rising market, wait for the price to pull back toward the uptrend line. Once the price touches or approaches the trendline, look for bullish reversal patterns or candlestick formations (e.g., Hammer, Bullish Engulfing) to confirm the uptrend’s continuation.
2. Sell on a Rally to a Downtrend Line:
• In a falling market, wait for the price to rally toward the downtrend line. When the price hits or approaches the trendline, look for bearish reversal patterns (e.g., Shooting Star, Bearish Engulfing) to confirm that the downtrend will likely continue.
3. Trade Breakouts:
• If the price breaks through a trendline (either up or down), this can indicate a trend reversal. In the case of a breakout above a downtrend line, you may buy to catch the start of a new uptrend. For a breakdown below an uptrend line, you may sell or short-sell to capitalize on the beginning of a downtrend.
________________________________________
How to Combine Trendlines with Volume, MACD, OBV to Improve Winning Rates
________________________________________
1. Volume Confirmation:
• Volume is crucial when using trendlines. A trendline breakout is more reliable when accompanied by a surge in volume. For example, if the price breaks above a downtrend line with high volume, it signals strong buying interest and increases the chances of a successful breakout.
• Conversely, a trendline breakdown below an uptrend line with high volume confirms that selling pressure is high, validating the bearish signal.
2. MACD for Trend Confirmation:
• The MACD (Moving Average Convergence Divergence) indicator helps confirm the strength of a trend or potential reversal.
o Buy Signal: If the price touches an uptrend line and the MACD crosses above the signal line, it reinforces the buy signal.
o Sell Signal: If the price rallies to a downtrend line and the MACD crosses below the signal line, it supports a sell or short-sell decision.
3. The OBV indicator is a cumulative measure of volume that adds or subtracts volume based on the direction of price movement:
The OBV helps to assess whether volume is supporting the price trend. In theory, changes in OBV often precede price movements. If volume increases sharply without much movement in price, it can signal that a breakout is coming.
Trendline Breaks in OBV as a Leading Indicator: OBV often provides signals earlier than the price. If the OBV breaks its trendline before the price does, it can serve as an early warning of a potential price breakout or breakdown.
Divergences Are Powerful Reversal Signals: Pay close attention to divergences between the price trend and OBV. When OBV fails to confirm price movement, it often signals a reversal in the trend.
Confirmation with Price Breakouts: Always wait for confirmation from the price action. Even if OBV breaks its trendline, ensure the price breaks its trendline as well before entering a trade.
Volume Drives the Trend: OBV reflects the strength of buying and selling pressure. A trendline breakout in price that is supported by OBV confirms the strength of the trend and increases the likelihood of a successful trade.
________________________________________
Effective Strategy for Trendline Trading
________________________________________
1. Identify the Trendline:
• Begin by identifying a valid trendline in the market, whether it is an uptrend (support) or a downtrend (resistance). Ensure the trendline connects at least two or three significant highs or lows.
2. Confirm with Volume and Indicators:
• Combine the trendline with volume analysis. If the price approaches the trendline, monitor volume to see whether it spikes (confirming strength) or decreases (suggesting weakness).
• Use MACD to confirm trend direction and RSI to assess overbought or oversold conditions at the trendline.
3. Set Entry and Exit Points:
• Entry: Buy when the price touches the uptrend line and bounces or sell when the price touches the downtrend line and gets rejected.
• Exit: Set a stop-loss slightly below the trendline for uptrend trades or above the trendline for downtrend trades to protect against false signals. Use price targets based on previous highs/lows or Fibonacci retracement levels.
4. Trade Breakouts:
• For a breakout strategy, enter the trade when the price breaks through the trendline with confirmation from volume and MACD. Set a stop-loss below the breakout point (for bullish breakouts) or above the breakdown point (for bearish breakouts).
________________________________________
How to Use Trendlines to Determine the Target Price
Trendlines are not only useful for identifying the direction of the trend but also for setting target prices for taking profits. Here’s how traders can use trendlines to estimate target prices in their trades:
1. Trendline Channels
• How It Works: Trendline channels involve drawing two parallel trendlines: one connecting the highs (resistance) and the other connecting the lows (support). When the price is moving within this channel, traders can project potential target prices.
o In an upward trendline channel, the price tends to bounce between the support and resistance lines. If you are in a long trade (buying), you can use the resistance trendline as your target price. Conversely, if you are in a short trade (selling), you can use the support trendline as your target price.
o In a downward trendline channel, the price also moves between the two parallel lines. Short-sellers will use the lower trendline (support) as their price target, while buyers may use the upper trendline (resistance) if they are expecting a reversal.
o Example: If the price bounces off the support trendline and moves upwards, a trader can set their target at the resistance trendline, which gives them a clear potential exit point.
2. Trendline Breakout or Breakdown
• How It Works: When a trendline is broken — either upwards or downwards — it can signal a significant price move in the direction of the breakout. To set a target price after a breakout or breakdown, you can use several methods:
o Measure the Previous Trend’s Height: Measure the vertical distance from the start of the trend to the point where the trendline begins. This distance can then be projected from the breakout point as a potential target.
o Example: Suppose a stock has been rising in an uptrend, and the distance between the support trendline and the peak is $50. If the price breaks out above the resistance trendline, the trader could project a $50 price increase above the breakout point, making it their target price.
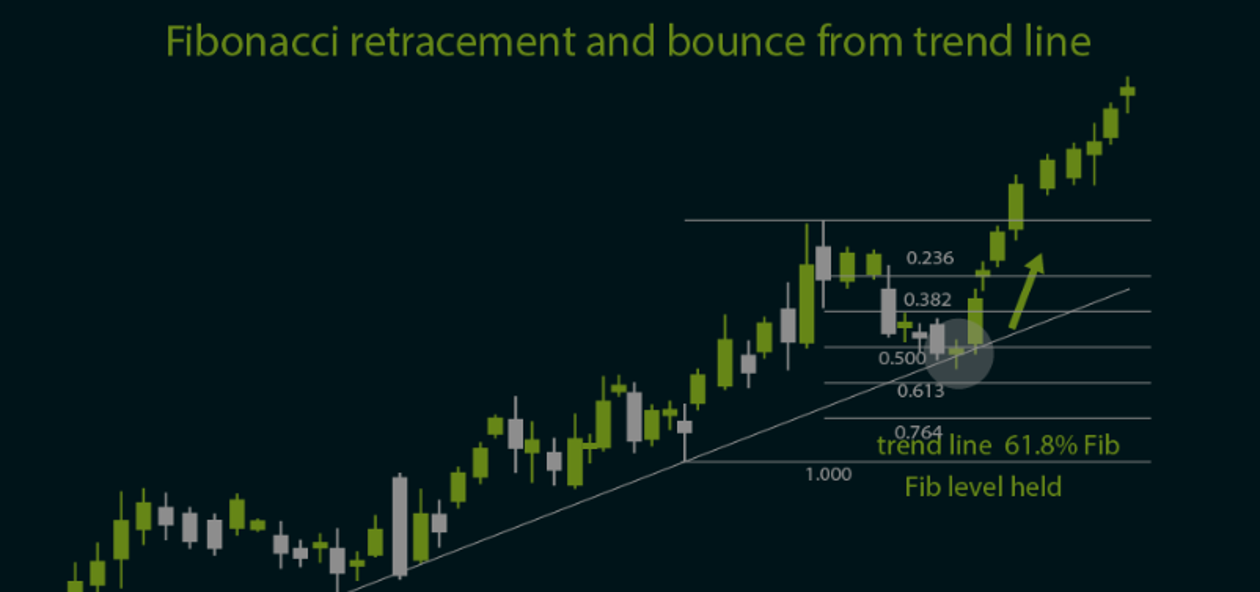
3. Using Fibonacci retracement
• How It Works: Fibonacci retracement are popular tools that can be used alongside trendlines to determine target prices after a breakout. Once a trendline is broken, traders often use Fibonacci retracement levels (such as 61.8% or 32.8%) to set support or resistance level based on the length of the previous trend.
o Example: In an upward-trending stock, you could draw a trendline connecting the lows, and once the price breaks above the resistance trendline, apply Fibonacci retracement to project potential support level.
4. Retesting the Trendline
• How It Works: After a breakout, it is common for the price to retest the broken trendline before continuing in the direction of the breakout. Traders can use this retest as an opportunity to refine their entry point or confirm the breakout. After the retest, traders can use the same methods (such as measuring the distance of the previous trend) to set target prices.
o Example: If a price breaks above a downward trendline and then retests that trendline from the other side, traders can enter the trade after the retest and use the previous swing high as a potential target price.
________________________________________
Step-by-Step Guide: Using Trendlines to Determine Target Price
1. Draw the Trendline:
o Identify the trend by connecting two or more swing highs (for resistance) or two or more swing lows (for support).
o If the price is in a channel, draw parallel trendlines to outline the path of the trend.
2. Identify the Breakout or Retest:
o Watch for price action that breaks above or below the trendline (depending on whether the trend is bullish or bearish).
o Look for a retest of the trendline to confirm the breakout.
3. Measure the Distance of the Previous Trend:
o For a more accurate target, measure the height of the previous trend (the distance between the lowest low and the highest high in an uptrend or vice versa in a downtrend).
o Project this distance from the breakout point to set your target.
4. Use Fibonacci Extensions for Longer Targets:
o Apply Fibonacci extensions to project potential target levels beyond the previous swing high or low, particularly useful in strong trending markets.
o Use the 161.8% and 261.8% extension levels for realistic long-term targets.
5. Set a Realistic Target Price:
o Use the trendline’s resistance or support (if within a channel) as a primary target.
o If the trendline breaks, project the previous trend’s height or use Fibonacci extensions to determine the target.
________________________________________
Example: Applying Trendlines to Set a Target Price in an Uptrend
1. Drawing the Trendline: Suppose you’re analysing a stock in an uptrend. You draw a trendline connecting the series of higher lows, showing consistent support as the price moves upward.
2. Identify a Trendline Breakout: The stock price forms higher lows but fails to break above resistance. Suddenly, it breaks out above the trendline’s upper boundary, signalling a bullish breakout.
3. Measuring the Height of the Trend: You measure the distance between the lowest swing low and the recent swing high, which is $20. You expect a similar price move upward after the breakout.
4. Setting the Target: You project the $20 distance from the breakout point, setting your target price at $20 above the breakout level.
5. Adjusting for Fibonacci Extensions: Additionally, you use Fibonacci extensions and find that the 161.8% extension aligns with a level just slightly above your projected target, further confirming the target price.
________________________________________
Conclusion
Trendlines are a versatile and powerful tool in technical analysis, helping traders visually identify trends, support, and resistance levels. When applied correctly, they offer strong signals for buying, selling, and breakout trades. By combining trendlines with volume, MACD, and RSI, traders can improve the reliability of their trades and increase their winning rate. Following best practices, such as using multiple touchpoints and confirming with indicators, helps traders avoid common mistakes and maximize the effectiveness of trendlines in their trading strategies. Thank you
