When combined with sophisticated market scanners, technical scanning changes the game when it comes to spotting trading chances. With the help of these cutting-edge tools, traders can quickly sort through enormous volumes of market data and identify particular patterns, indicators, and circumstances that could result in profitable trading outcomes.

Based on technical analysis, traders deploy technical scanning to find possible trading opportunities in financial markets. It entails searching through a sizable number of stocks, indexes, or other trading instruments with specialist tools and software, like Minichart’s Market Scanner, to identify particular patterns or circumstances that satisfy predetermined criteria.
An outline of how technical scanning with a market scanner operates is provided below:
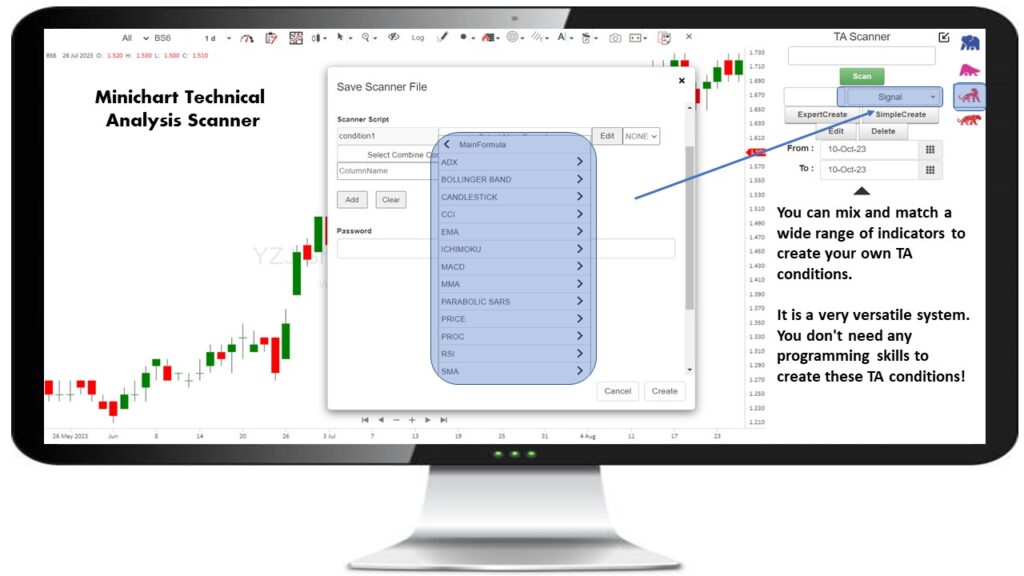
- Establish your criteria: Prior to utilising a market scanner, you must decide which particular patterns or situations you hope to detect. Price patterns, indicators, volume, and any other technical elements you deem significant for trading should be included in these criteria.
- Configure the scan: Set the scanner to filter the instruments according to your specifications. This could entail deciding on the timeline, putting up particular patterns or technical indications, and stating additional requirements that must be fulfilled.
- Execute the scan: Once the scan is started, the market scanner will evaluate the chosen instruments based on the parameters you have specified. Securities that meet the criteria you have provided will be found by the scanner.
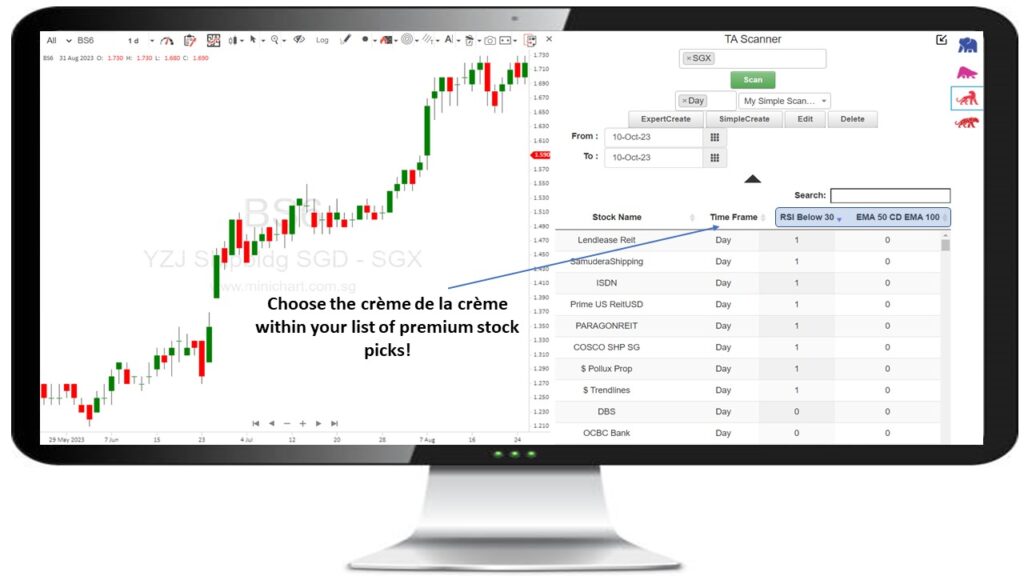
- Examine the results: The market scanner will show you a list of securities that fit your criteria after the scan is finished. After reviewing the results, you can concentrate on the ones that seem intriguing or fit in with your trading plan.
- Carry out additional research: The market scanner’s findings provide you a good place to start, but you’ll need to look at the securities you found in more detail. To verify the trade opportunity, this may entail looking at charts, additional technical indicators, fundamental data, or other pertinent information.
- Put your trading strategy into action: If your analysis indicates that there is a trading opportunity, you can move forward with your trading plan. This could entail opening a trade, determining take-profit and stop-loss thresholds, and managing your holdings in accordance with your risk-management guidelines.

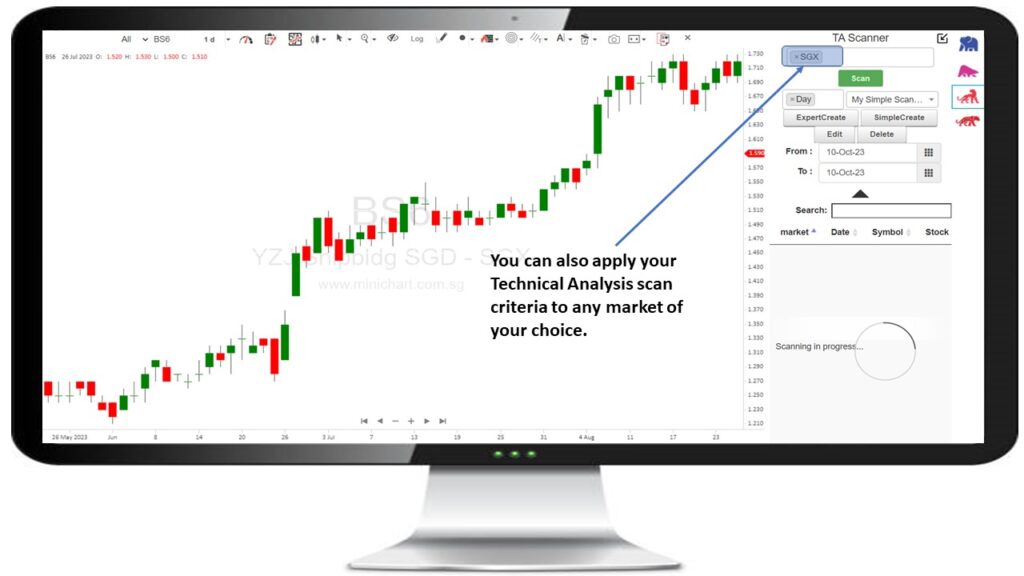
You can apply your Technical Analysis scan criteria to any market of your choice.

Choose the crème de la crème within your list of premium stock picks!🤑